


To adapt the Graded Chronic Pain Scale for use in primary care patients in Spain, and to assess its psychometric properties.
MethodsClinical measures observational study investigating the severity of chronic pain. The methodology included a process of translation and back-translation following the international guidelines. Study participants were 75 patients who experienced lower back pain for more than six months and were sent to primary care physiotherapy units. Internal consistency, construct validity, test–retest reliability, floor and ceiling effects, and answering capacity were analyzed.
ResultsThe Spanish version of the Graded Chronic Pain Scale had a high internal consistency, with a Cronbach's α of 0.87 and intraclass correlation coefficient of 0.81. Regarding construct validity, it was identified that two factors explained 72.37% of the variance. Convergent validity showed a moderate positive correlation with the Visual Analog Scale, the activity avoidance subscale of the Tampa Scale of Kinesophobia, the Pain Catastrophizing Scale, the Roland-Morris Low Back Pain and Disability Questionnaire, and the Fear Avoidance Beliefs Questionnaire. A moderate negative correlation was identified with the Chronic Pain Self-Efficacy Scale. The mean time of questionnaire administration was 2min and 28s.
ConclusionsThe Spanish version of the Graded Chronic Pain Scale appears to be a valid, reliable, and useful tool for measuring chronic pain at an early stage in primary care settings in Spain.
Adaptar la Escala de gradación del dolor crónico en pacientes de Atención Primaria en España y evaluar sus propiedades psicométricas.
MétodosEstudio observacional de medición clínica de una escala de magnitud del dolor crónico. Se realizó un proceso de traducción-retrotraducción siguiendo las guías internacionales. Setenta y cinco sujetos con dolor lumbar de más de 6 meses de evolución derivados a las unidades de fisioterapia en Atención Primaria participaron en el estudio. Se analizaron: la consistencia interna, la validez del constructo, la fiabilidad test–retest, los efectos techo y suelo, y la capacidad de respuesta.
ResultadosLa Escala de gradación del dolor crónico posee una alta consistencia interna, el α de Cronbach fue de 0,87, similar al que presentan las versiones en otros idiomas, y el coeficiente de correlación intraclase fue 0,81. En cuanto a la validez del constructo, se extrajeron 2 factores que consiguieron explicar el 72,37% de la varianza. La validez convergente muestra una correlación positiva moderada con la escala visual analógica, la subescala de evitación de actividad de la Escala Tampa de kinesiofobia, la Escala del catastrofismo para el dolor, el Cuestionario de discapacidad por dolor lumbar de Roland-Morris, y el Cuestionario de conductas de miedo-evitación, y una correlación negativa moderada con el Cuestionario de autoeficacia en el dolor crónico. El tiempo medio de administración fue de 2min y 28s.
ConclusionesLa versión española de la Escala de gradación del dolor crónico parece ser un instrumento válido, fiable y útil para medir de forma precoz el dolor crónico en la práctica clínica en Atención Primaria en España.
Chronic pain is classically defined as an unpleasant experience that persists for over 6 months.1 This definition, based on the transient nature of that experience, overlooks key components that accompany patients with chronic pain, such as disability and the resulting reduction of physical activity,2 which generate an increase in absenteeism from work, a significant loss of quality of life and a great socioeconomic impact.3
According to the International Classification of Functioning, Disability and Health, disability is a multifactorial phenomenon in which physical, mental and emotional functions alternate, and which is present in chronic pain.4,5 Chronic pain affects 17.25% of the adult population in Spain,6 and some authors have reported its prevalence to be around 23.4%.7
The early detection and management of pain proves to be especially important to mitigate its effects on the patients and health systems of the European countries.3 At the present time, what we need in Spain are tools that are dynamic and simple enough to allow their immediate use, enabling the rapid diagnosis and subclassification of patients with chronic nononcological pain, since the management of patients of this type continues to need improvement.8
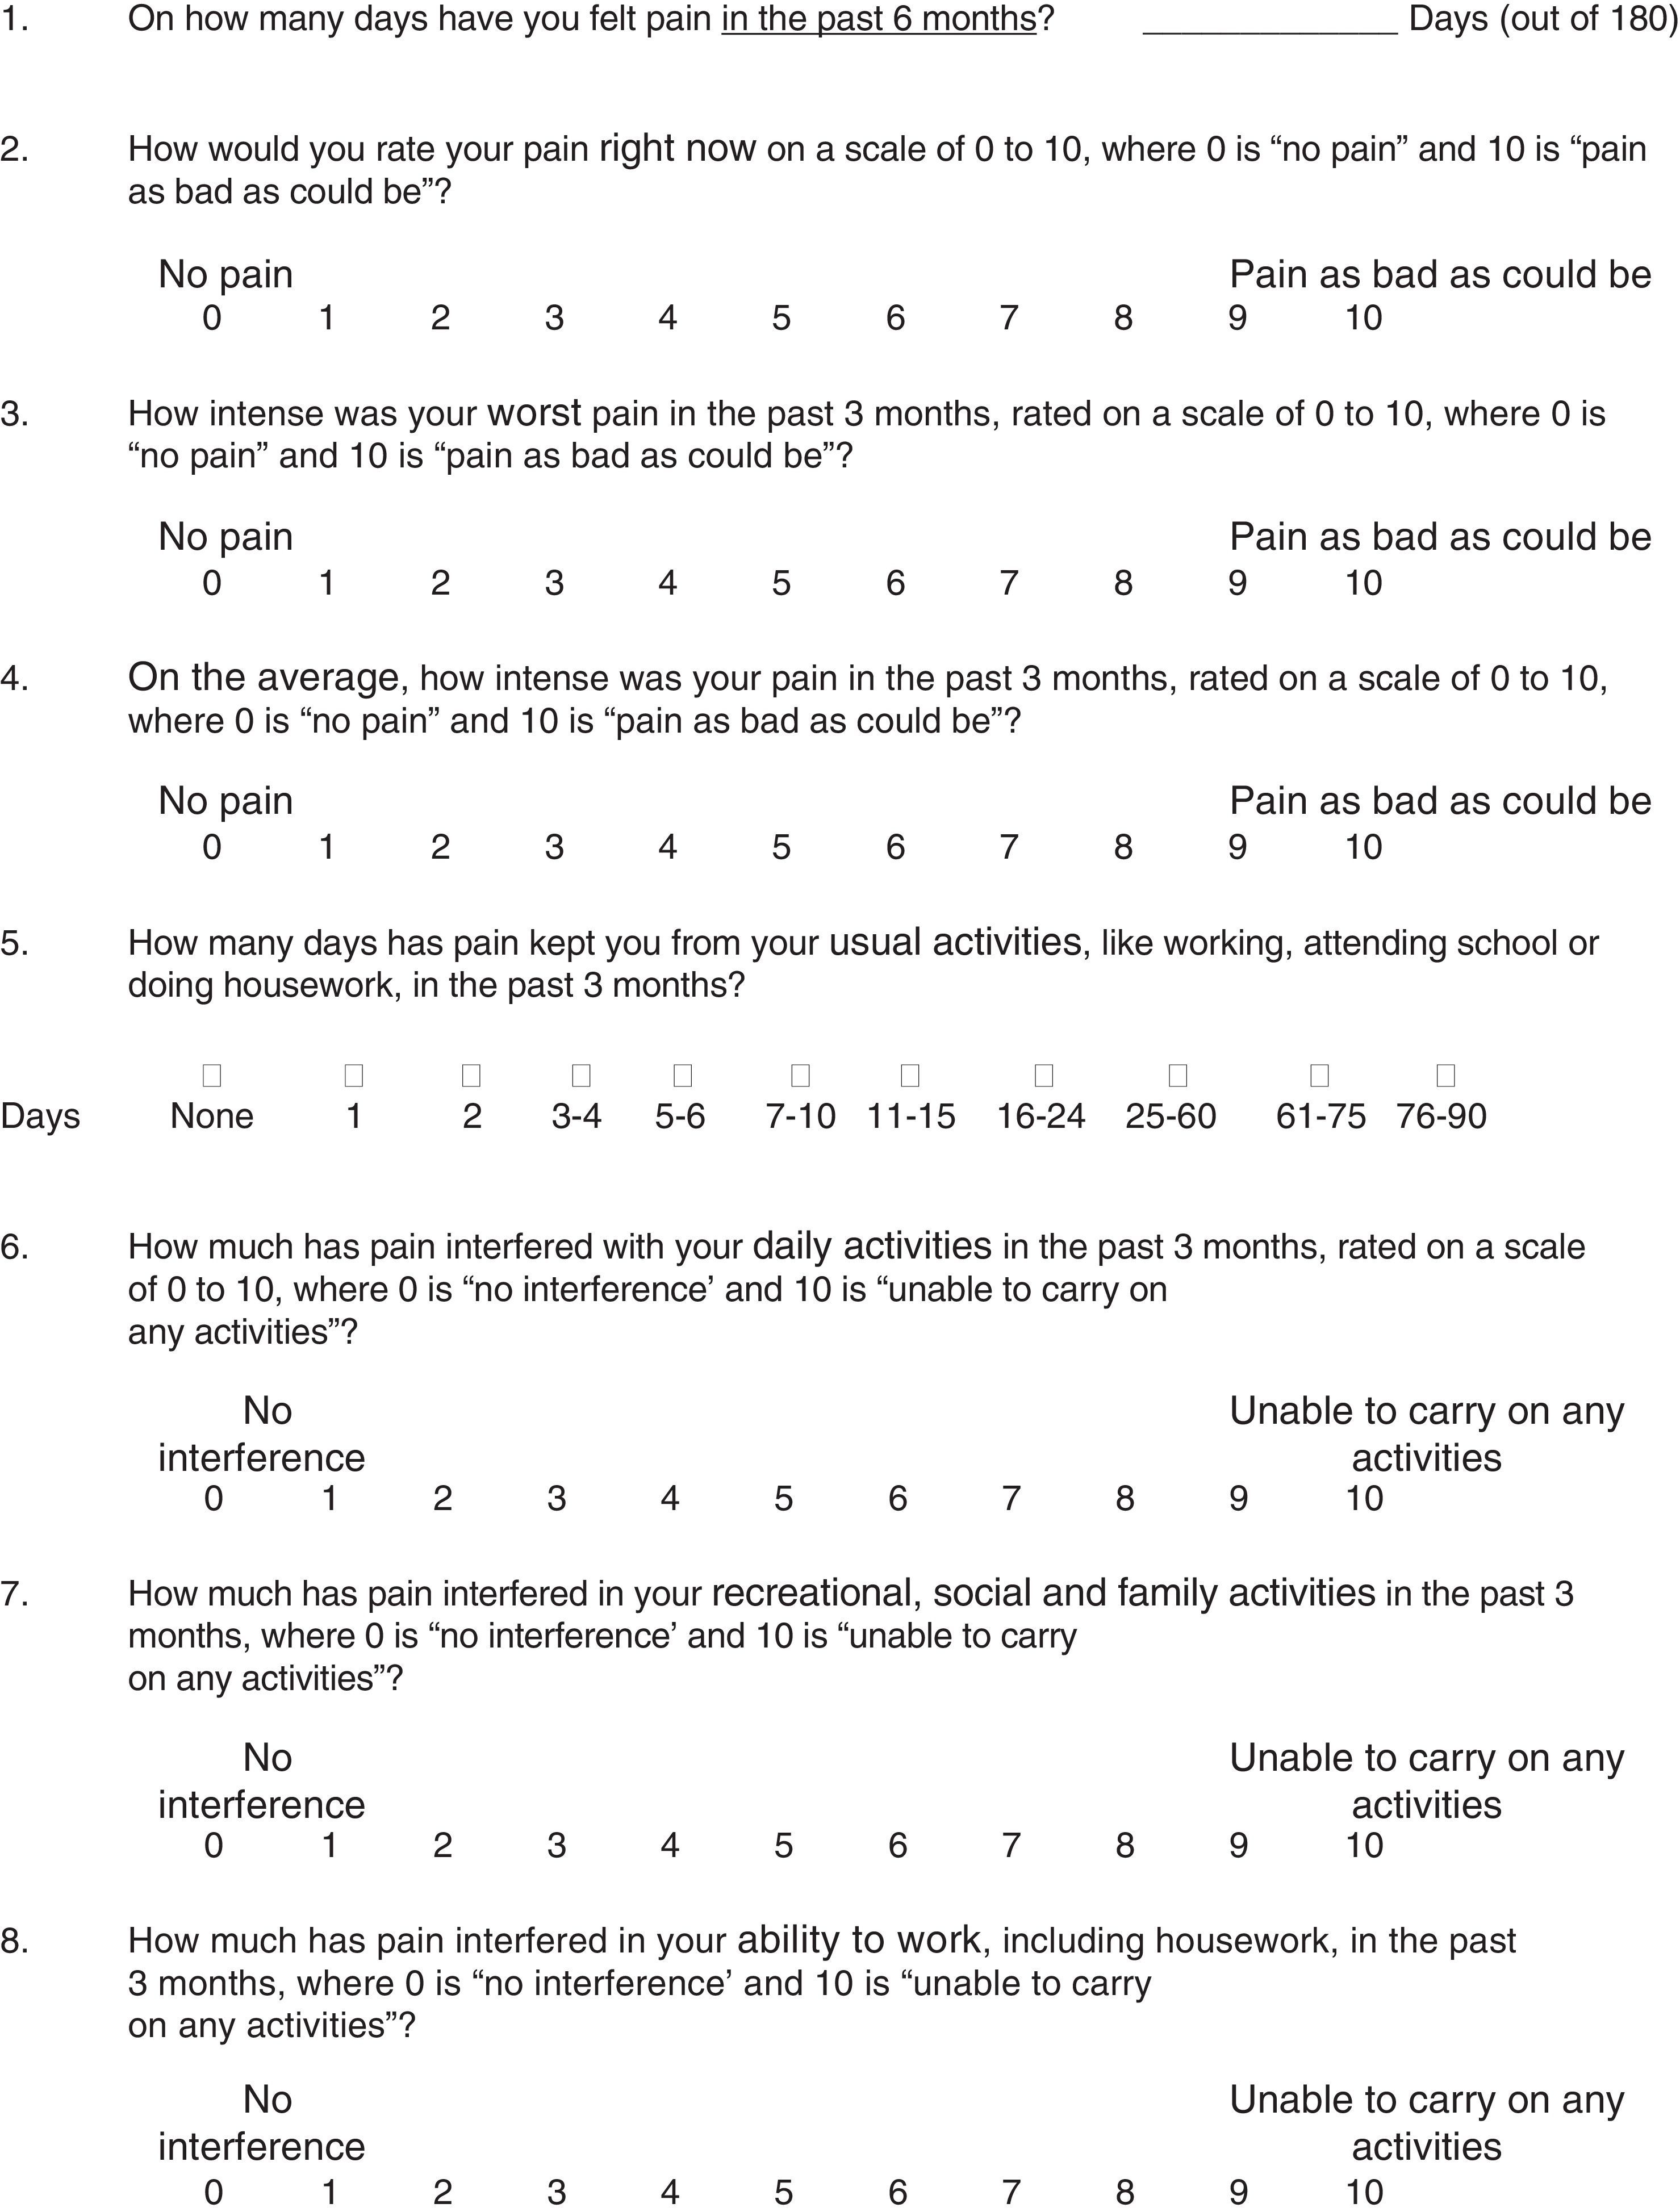
The Chronic Pain Grade Questionnaire is a self-report instrument composed of 7 items that are scored on an 11-point Likert scale, with a total range of 0–70 points. It was originally designed in English for the evaluation of the intensity of chronic pain,9 and has been validated for and translated to several languages.10–12 Two of these versions were generated in the primary care setting.11,12 The version updated in 2010 converted the initial questionnaire into a scale of 8 items, the Graded Chronic Pain Scale 2.0 (GCPS).13
The objective of this investigation is to produce a cross-cultural Spanish-language adaptation of the GCPS in a sample of patients who were being treated for chronic low back pain in Spanish primary care services. As a secondary endpoint, we plan to carry out an initial psychometric analysis of the efficacy of the tool in this sample population.
MethodsFrom September 2013 to July 2014, we conducted a prospective observational study for the psychometric validation and cross-cultural adaptation of the GCPS. The study was carried out in 2 phases: (a) the application of a structured protocol for cross-cultural adaptation to determine the linguistic validity of the scale, and (b) the verification of the psychometric properties of the scale, which are described below in the section on Data Analysis.
All the research procedures used in this study were established in accordance with the declaration of Helsinki and had been approved by the bioethics committee of Hospital Universitario La Paz in Madrid and by the research commission of the Health Care Administration (Southwest) for Primary Care in the Autonomous Community of Madrid.
Translation and Cross-cultural AdaptationCross-cultural adaptation of the GCPS involved the use of the 5-phase structured protocol proposed by Beaton et al.14 (Fig. 1). The initial phases of the translation were carried out by 2 linguistics experts and 2 native English speakers with full proficiency in Spanish. The final draft was subjected to an evaluation of the content validity before a panel of 6 expert judges, which included specialists in psychometry, linguistics and chronic pain. The criteria for the selection of the experts were as follows15: (a) experience in issuing rulings and evidence-based decision-making (research, publications and experience); (b) availability and motivation to participate; and (c) impartiality and flexibility. The members of the panel of expert judges were asked to provide a qualitative assessment of each of the items (degree of comprehensibility, suitability of the wording and phrasing), as well as a quantitative evaluation of the items, taking into account the following points: (1) appropriateness (the item applies to the established theoretical factors); (2) clarity (the item is easy to understand and has the proper semantics and syntax); (3) coherence (the item is related to the factor that it measures); and (4) relevance (the item is essential and should be included). The aspects to be evaluated for each item were scored using a 3-point Likert scale (1: Agree; 2: Neither agree nor disagree; 3: Disagree). Once the information provided by the panel of expert judges had been established and analyzed, a pilot test of the comprehensibility of the instrument was performed with 10 patients.
Validation of the Spanish Version
A nonprobabilistic sample of 75 patients with chronic low back pain was obtained by consecutive recruitment in 3 health centers of the Community of Madrid, Spain. The sample size was calculated taking into account the proportion of individuals to items of 10:1 recommended by Kline.16 All the recruited participants accepted voluntarily to participate in the study and gave their written informed consent.
The patients received a questionnaire on sociodemographic data, the GCPS and a battery of self-report instruments to check the convergent validity; these instruments were the Visual Analog Scale (VAS) to evaluate pain intensity, the Spanish version of the Pain Catastrophizing Scale (PCS) to analyze the level of catastrophism produced by the pain experience,17 the Spanish version of the Tampa Scale for Kinesiophobia (TSK-11) to evaluate fear of injury and of movement,18 the Spanish version of the Roland Morris Disability Questionnaire (RMDQ), which evaluates the physical disability caused by low back pain,19 the Chronic Pain Self-efficacy Scale (CPSS), which was used to evaluate the degree of self-efficacy,20 and the Spanish version of the Fear-Avoidance Beliefs Questionnaire (FABQ).21
Data AnalysisThe data from this study were analyzed using the SPSS software package (version 22.0). The descriptive statistics are expressed as the mean±standard deviation (SD), range and 95% confidence interval (CI). The statistical inference utilized to verify the psychometric properties involved the use of the following tests:
The content validity of the final draft of the GCPS was calculated using Aiken's V coefficient,22,23 the value of which ranges between 0 and 1; in principle, values lower than 0.70 should be rejected and should ultimately not be included.24
The internal consistency of the instrument was analyzed using Cronbach's α coefficient and item-total correlation. Internal consistency is considered to be adequate when the α coefficient is greater than or equal to 0.70.25
The factor structure was analyzed by exploratory factor analyses of principal components. Prior to this, the adequacy for these analyses was tested using the Kaiser–Meyer–Olkin (KMO) measure and Bartlett's test of sphericity. The number of factors to be extracted is based on Kaiser's eigenvalue criterion (eigenvalue≥1) and the evaluation of the scree plot.
The ceiling and floor effects were analyzed on the basis of the percentage of patients with the lowest (floor) and highest (ceiling) scores on each item in the scale. The ceiling and floor effects are considered to occur when over 15% of those surveyed achieve the highest possible and lowest possible scores, respectively.26
The convergent validity was evaluated using Pearson's correlation coefficient measuring the association between the GCPS and the other instruments: VAS, TSK-11, PCS, CPSS, FABQ and RMDQ.
The test/retest reliability (reproducibility) was analyzed with the intraclass correlation coefficient (ICC). For this purpose, the GCPS was run twice at an interval of 7–10 days in a subsample of 46 patients. An ICC value over 0.70 is considered acceptable.26
The measurement error is expressed as a standard error of measurement (SEM), which is calculated using the formula SEM=SD×√1−ICC. The error of measurement is the systematic error and the random error in a patient's score that are not attributable to real changes in the construct to be measured.27
The responsiveness was evaluated according to the minimal detectable change (MDC). The MDC expresses the minimal change necessary to be sure, with a 90% confidence level, that a change observed between 2 measurements reflects a real change and not a measurement error. It is calculated using the formula MCD=SEM×√2×1.96.28
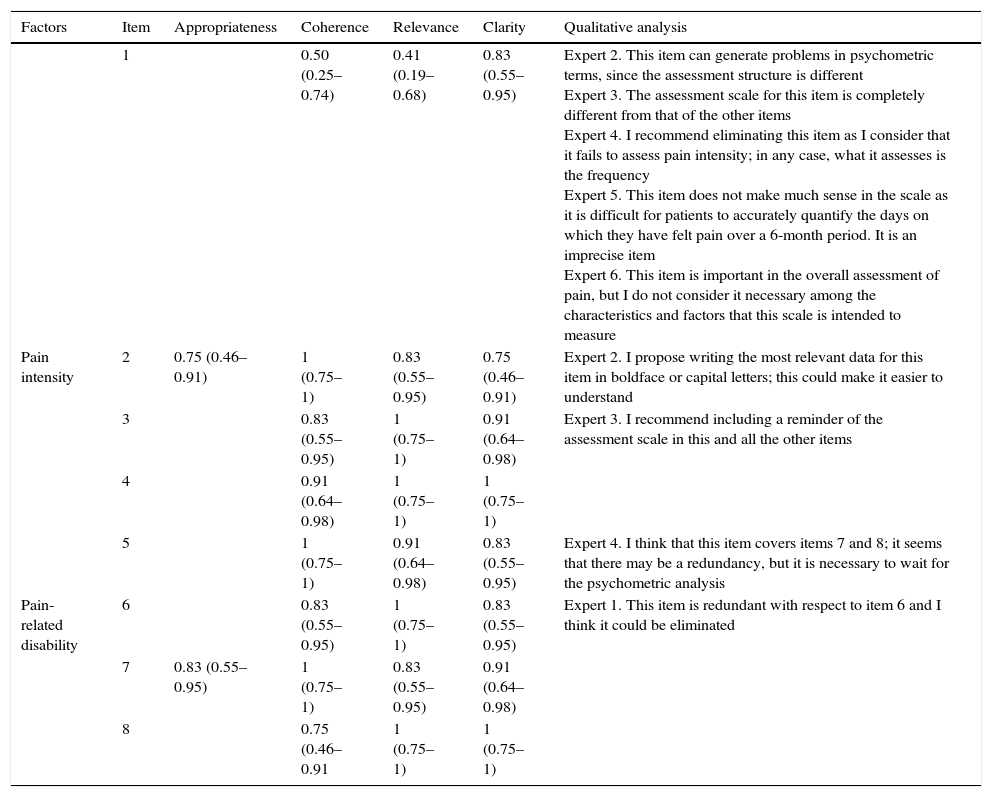
ResultsAfter the process of translation and back-translation, the 2 back-translations of the 8 items were considered to be equivalent, with no important differences in terms of semantics. With respect to the content validity, the quantitative and qualitative analysis of the scale is described in Table 1. Item 1 was the only item that had values less than 0.70 in the evaluation of the content; nevertheless, it was not excluded for the purpose of observing its psychometric performance in the analysis of the internal consistency.
Representation of the Analysis of Content Validity and Structured Summary of the Qualitative Analysis of the Items Arranged in Groups.
| Factors | Item | Appropriateness | Coherence | Relevance | Clarity | Qualitative analysis |
|---|---|---|---|---|---|---|
| 1 | 0.50 (0.25–0.74) | 0.41 (0.19–0.68) | 0.83 (0.55–0.95) | Expert 2. This item can generate problems in psychometric terms, since the assessment structure is different Expert 3. The assessment scale for this item is completely different from that of the other items Expert 4. I recommend eliminating this item as I consider that it fails to assess pain intensity; in any case, what it assesses is the frequency Expert 5. This item does not make much sense in the scale as it is difficult for patients to accurately quantify the days on which they have felt pain over a 6-month period. It is an imprecise item Expert 6. This item is important in the overall assessment of pain, but I do not consider it necessary among the characteristics and factors that this scale is intended to measure | ||
| Pain intensity | 2 | 0.75 (0.46–0.91) | 1 (0.75–1) | 0.83 (0.55–0.95) | 0.75 (0.46–0.91) | Expert 2. I propose writing the most relevant data for this item in boldface or capital letters; this could make it easier to understand |
| 3 | 0.83 (0.55–0.95) | 1 (0.75–1) | 0.91 (0.64–0.98) | Expert 3. I recommend including a reminder of the assessment scale in this and all the other items | ||
| 4 | 0.91 (0.64–0.98) | 1 (0.75–1) | 1 (0.75–1) | |||
| 5 | 1 (0.75–1) | 0.91 (0.64–0.98) | 0.83 (0.55–0.95) | Expert 4. I think that this item covers items 7 and 8; it seems that there may be a redundancy, but it is necessary to wait for the psychometric analysis | ||
| Pain-related disability | 6 | 0.83 (0.55–0.95) | 1 (0.75–1) | 0.83 (0.55–0.95) | Expert 1. This item is redundant with respect to item 6 and I think it could be eliminated | |
| 7 | 0.83 (0.55–0.95) | 1 (0.75–1) | 0.83 (0.55–0.95) | 0.91 (0.64–0.98) | ||
| 8 | 0.75 (0.46–0.91 | 1 (0.75–1) | 1 (0.75–1) |
The numerical data represent the results of the content analysis using Aiken's V coefficient, with the 95% confidence interval in parentheses.
In the evaluation of understandability, the participants in the pilot test had no difficulty in responding to the items of the GCPS. The average time required to complete the questionnaire was 2min and 28s, and the range, 1min and 8s to 7min and 44s.
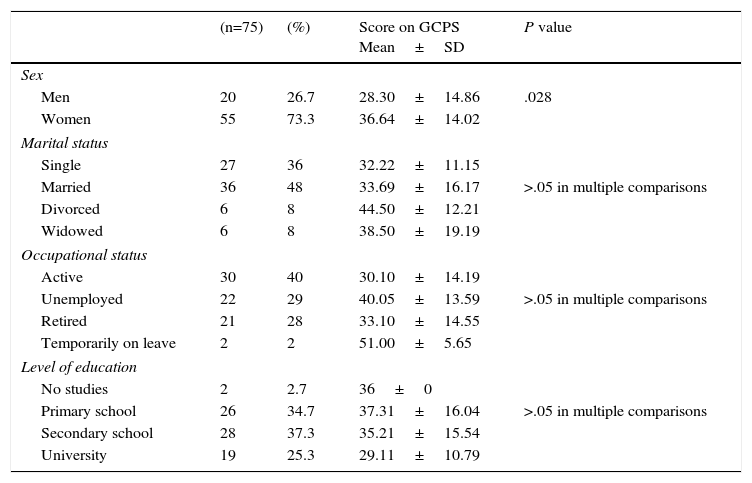
The sociodemographic characteristics of the sample are shown in Tables 2 and 3, together with the mean±SD of the overall GCPS scores according to gender, marital status, occupational status and level of education of the participants.
Sociodemographic Characteristics of the Participants in the Study.
| (n=75) | (%) | Score on GCPS Mean±SD | P value | |
|---|---|---|---|---|
| Sex | ||||
| Men | 20 | 26.7 | 28.30±14.86 | .028 |
| Women | 55 | 73.3 | 36.64±14.02 | |
| Marital status | ||||
| Single | 27 | 36 | 32.22±11.15 | |
| Married | 36 | 48 | 33.69±16.17 | >.05 in multiple comparisons |
| Divorced | 6 | 8 | 44.50±12.21 | |
| Widowed | 6 | 8 | 38.50±19.19 | |
| Occupational status | ||||
| Active | 30 | 40 | 30.10±14.19 | |
| Unemployed | 22 | 29 | 40.05±13.59 | >.05 in multiple comparisons |
| Retired | 21 | 28 | 33.10±14.55 | |
| Temporarily on leave | 2 | 2 | 51.00±5.65 | |
| Level of education | ||||
| No studies | 2 | 2.7 | 36±0 | |
| Primary school | 26 | 34.7 | 37.31±16.04 | >.05 in multiple comparisons |
| Secondary school | 28 | 37.3 | 35.21±15.54 | |
| University | 19 | 25.3 | 29.11±10.79 | |
GCPS, Graded Chronic Pain Scale; SD, standard deviation.
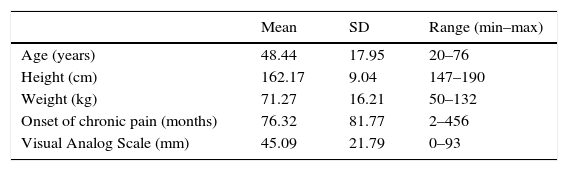
Demographic Characteristics of the Participants in the Study.
| Mean | SD | Range (min–max) | |
|---|---|---|---|
| Age (years) | 48.44 | 17.95 | 20–76 |
| Height (cm) | 162.17 | 9.04 | 147–190 |
| Weight (kg) | 71.27 | 16.21 | 50–132 |
| Onset of chronic pain (months) | 76.32 | 81.77 | 2–456 |
| Visual Analog Scale (mm) | 45.09 | 21.79 | 0–93 |
SD, standard deviation.
The present version of the GCPS consists of 8 items (Table 4). However, item 1 (“On how many days have you felt pain in the past 6 months?”) was excluded from the statistical analysis because the range of the scores for this item differed widely (18-fold greater) from those of the other 7 items, and its inclusion reduced the internal consistency of the questionnaire.

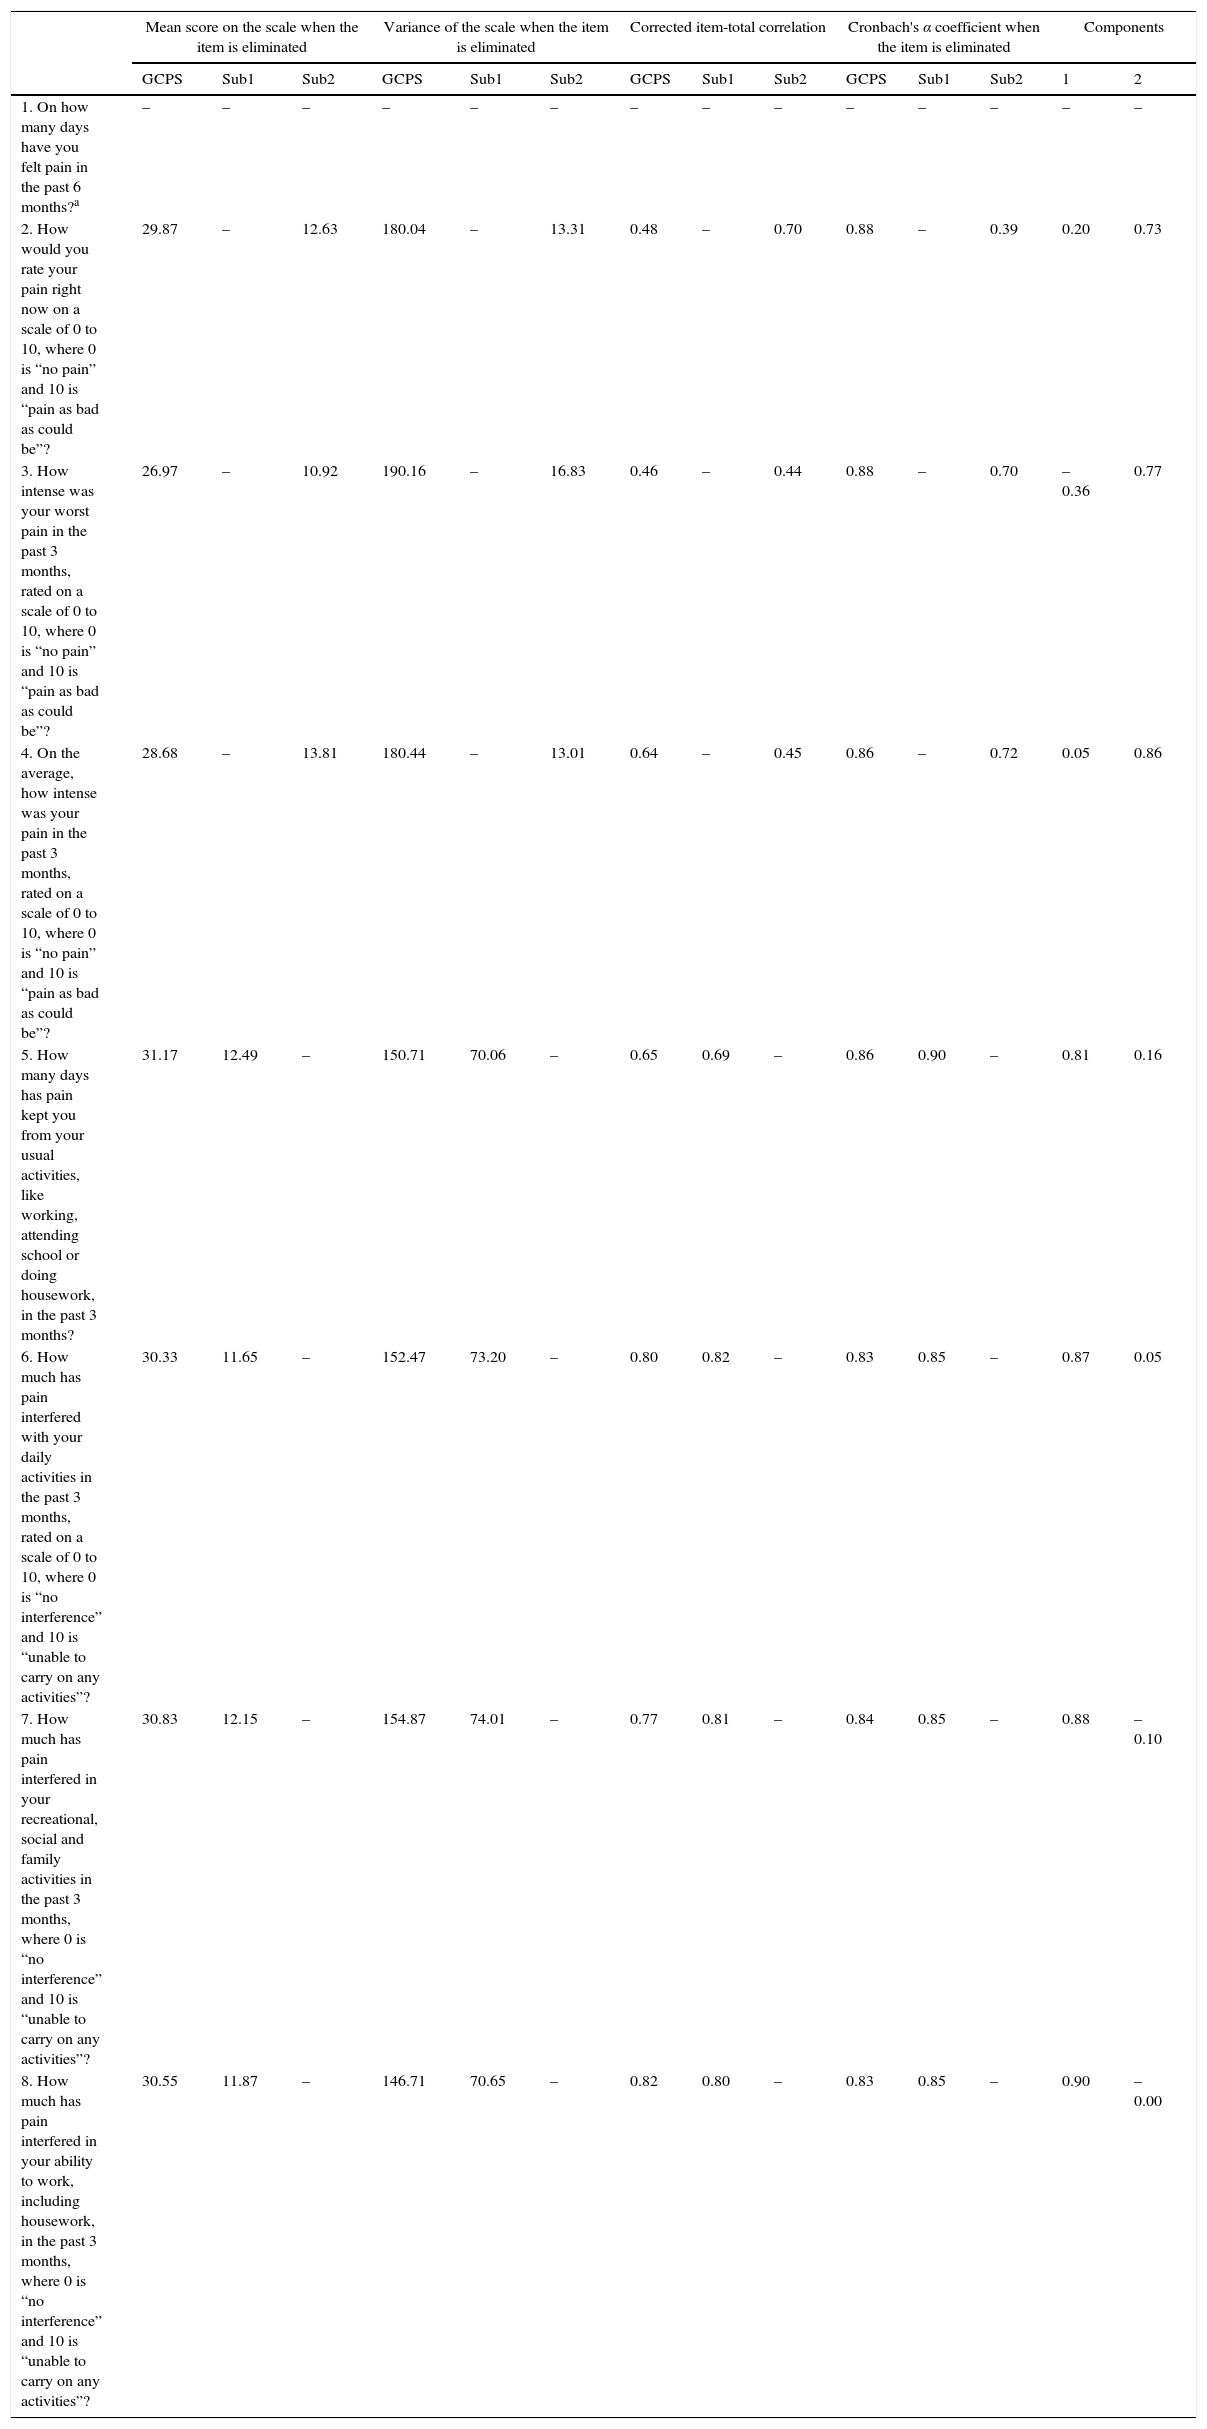
Cronbach's α coefficient was 0.87 (95% CI, 0.83–0.92), indicating a high internal consistency for a scale of only 7 items. The item-total correlation coefficients ranged from 0.47 to 0.82, where item 3 had the lowest correlation and item 8 the highest. The complete results of the 2 subscales can be found in Table 5.
Internal Consistency of the Graded Chronic Pain Scale and Component Structure in the Exploratory Factor Analysis.
| Mean score on the scale when the item is eliminated | Variance of the scale when the item is eliminated | Corrected item-total correlation | Cronbach's α coefficient when the item is eliminated | Components | ||||||||||
|---|---|---|---|---|---|---|---|---|---|---|---|---|---|---|
| GCPS | Sub1 | Sub2 | GCPS | Sub1 | Sub2 | GCPS | Sub1 | Sub2 | GCPS | Sub1 | Sub2 | 1 | 2 | |
| 1. On how many days have you felt pain in the past 6 months?a | – | – | – | – | – | – | – | – | – | – | – | – | – | – |
| 2. How would you rate your pain right now on a scale of 0 to 10, where 0 is “no pain” and 10 is “pain as bad as could be”? | 29.87 | – | 12.63 | 180.04 | – | 13.31 | 0.48 | – | 0.70 | 0.88 | – | 0.39 | 0.20 | 0.73 |
| 3. How intense was your worst pain in the past 3 months, rated on a scale of 0 to 10, where 0 is “no pain” and 10 is “pain as bad as could be”? | 26.97 | – | 10.92 | 190.16 | – | 16.83 | 0.46 | – | 0.44 | 0.88 | – | 0.70 | –0.36 | 0.77 |
| 4. On the average, how intense was your pain in the past 3 months, rated on a scale of 0 to 10, where 0 is “no pain” and 10 is “pain as bad as could be”? | 28.68 | – | 13.81 | 180.44 | – | 13.01 | 0.64 | – | 0.45 | 0.86 | – | 0.72 | 0.05 | 0.86 |
| 5. How many days has pain kept you from your usual activities, like working, attending school or doing housework, in the past 3 months? | 31.17 | 12.49 | – | 150.71 | 70.06 | – | 0.65 | 0.69 | – | 0.86 | 0.90 | – | 0.81 | 0.16 |
| 6. How much has pain interfered with your daily activities in the past 3 months, rated on a scale of 0 to 10, where 0 is “no interference” and 10 is “unable to carry on any activities”? | 30.33 | 11.65 | – | 152.47 | 73.20 | – | 0.80 | 0.82 | – | 0.83 | 0.85 | – | 0.87 | 0.05 |
| 7. How much has pain interfered in your recreational, social and family activities in the past 3 months, where 0 is “no interference” and 10 is “unable to carry on any activities”? | 30.83 | 12.15 | – | 154.87 | 74.01 | – | 0.77 | 0.81 | – | 0.84 | 0.85 | – | 0.88 | –0.10 |
| 8. How much has pain interfered in your ability to work, including housework, in the past 3 months, where 0 is “no interference” and 10 is “unable to carry on any activities”? | 30.55 | 11.87 | – | 146.71 | 70.65 | – | 0.82 | 0.80 | – | 0.83 | 0.85 | – | 0.90 | –0.00 |
GCPS, graded chronic pain scale; Sub1, pain intensity subscale; Sub2, disability subscale.
Exploratory factor analysis of the principal components was performed without rotation. In addition, for theoretical reasons, we tested a 2-factor structure using oblimin rotation, which converged in 4 iterations; finally, we chose a 2-factor solution supported by the scree plot (Fig. 2).

The KMO measure of sampling adequacy of 0.82 was higher than the recommended value of 0.60, and the results of Bartlett's test were significant (chi-squared=293.44, df=21, P<.001), indicating the adequacy of the data for performing principal components analysis.
The first factor, composed of 4 items, can be referred to as “pain-related disability”; the second, “pain intensity”, consists of 3 items. The correlation between the 2 rotated factors was 0.55. These factors explain the total variance of 72.37%; the distribution of the items is shown in Table 5.
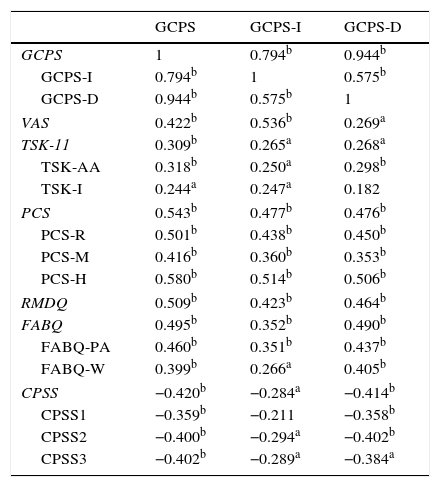
Convergent ValidityThe overall value on the GCPS showed a moderately positive correlation with all the questionnaires used except the TSK-11 injury subscale, and moderately negative with the CPSS (Table 6).
Pearson's Correlation Between Self-report Instruments and the Spanish Version of the Graded Chronic Pain Score and its Intensity and Disability Subscales.
| GCPS | GCPS-I | GCPS-D | |
|---|---|---|---|
| GCPS | 1 | 0.794b | 0.944b |
| GCPS-I | 0.794b | 1 | 0.575b |
| GCPS-D | 0.944b | 0.575b | 1 |
| VAS | 0.422b | 0.536b | 0.269a |
| TSK-11 | 0.309b | 0.265a | 0.268a |
| TSK-AA | 0.318b | 0.250a | 0.298b |
| TSK-I | 0.244a | 0.247a | 0.182 |
| PCS | 0.543b | 0.477b | 0.476b |
| PCS-R | 0.501b | 0.438b | 0.450b |
| PCS-M | 0.416b | 0.360b | 0.353b |
| PCS-H | 0.580b | 0.514b | 0.506b |
| RMDQ | 0.509b | 0.423b | 0.464b |
| FABQ | 0.495b | 0.352b | 0.490b |
| FABQ-PA | 0.460b | 0.351b | 0.437b |
| FABQ-W | 0.399b | 0.266a | 0.405b |
| CPSS | −0.420b | −0.284a | −0.414b |
| CPSS1 | −0.359b | −0.211 | −0.358b |
| CPSS2 | −0.400b | −0.294a | −0.402b |
| CPSS3 | −0.402b | −0.289a | −0.384a |
CPSS, Chronic Pain Self-efficacy Scale; CPSS1, Chronic Pain Self-efficacy Scale, coping subscale; CPSS2, Chronic Pain Self-efficacy Scale, function subscale; CPSS3, Chronic Pain Self-efficacy Scale, pain subscale; FABQ, Fear-Avoidance Beliefs Questionnaire; FABQ-PA, Fear-Avoidance Beliefs Questionnaire, physical activity subscale; FABQ-W, Fear-Avoidance Beliefs Questionnaire, work subscale; GCPS, Graded Chronic Pain Scale; GCPS-D, Graded Chronic Pain Scale, disability subscale; GCPS-I, Graded Chronic Pain Scale, intensity subscale; PCS, Pain Catastrophizing Scale; PCS-H, Pain Catastrophizing Scale, helplessness subscale; PCS-M, Pain Catastrophizing Scale, magnification subscale; PCS-R, Pain Catastrophizing Scale, rumination subscale; RMDQ, Roland Morris Disability Questionnaire; TSK-11, Tampa Scale for Kinesiophobia; TSK-11-AA, Tampa Scale for Kinesiophobia, avoidance of activity subscale; TSK-11, Tampa Scale for Kinesiophobia, injury subscale; VAS, Visual Analog Scale.
The ICC was 0.81 (95% CI, 0.684–0.891), which showed a satisfactory temporal stability after 10 days, when analyzing the response to the GCPS of a randomized subsample of 46 participants (sex: women, n=31, 67.4%; age: 54.8±14.9 years; with a history of chronic pain of 74±84.13 months).
Standard Error of MeasurementThe SEM was 6.41, which translates into an error of 9.16%, and the score on agreement was high.
Ceiling–floor effectWe observed neither a ceiling nor a floor effect, as none of the participants scored the minimum (0 points) or the maximum (70 points) on the GCPS, in which the scores for the sample ranged from 6 to 64 points.
Minimal Detectable ChangeThe MDC for a 95% confidence level was 17.7 points.
DiscussionThe objective of the present study is to adapt the GCPS to the culture and to the Spanish language of Spain, as well as to analyze the basic psychometric properties of the instrument in its latest version. The adaptation of the GCPS to Spanish has shown a high level of internal consistency and high reliability on test–retest in the sample recruited for this study. To validate the scale, we have followed the usual guidelines for cross-cultural adaptation in the health sciences, taking into account the understandability of the items.14,29 The Spanish version of the GCPS has achieved a greater internal consistency than the versions in German and Brazilian Portuguese and the second factor of the Italian version (pain intensity).10–12 The first factor of the Italian version (disability) and the version in English had higher internal consistency than our version.10,30
The Spanish version of the scale consists of 8 items, and the final score was obtained from the sum of items 2 through 8. The author of the original scale decided to include the first item, which appears in the second version in English, to assess the perpetuation of pain in a retrospective manner as a key element in the chronification of pain.31
The GCPS proves to be of clinical value both because it takes little time to complete and because the number of items is manageable, in accordance with current recommendations on the use of short, simple scales that can be adapted to clinical use.32 It is a highly versatile instrument because of its alternative scoring system since, in addition to the range of 0–70 points, it can be complemented by chronic pain grading (Appendix A).
One of the differences between the GCPS and the original version of von Korff et al.9 is the sample size and the type of study subjects. The original version involved a sample of 2371 patients with low back pain, headache and temporomandibular dysfunction, whereas the version in Spanish recruited 75 patients with low back pain; moreover, the original study collected data via telephone. In turn, and concerning the diagnosis of the patients, the decision was made to study patients with chronic low back pain so that the sample would be as homogeneous as possible, although this circumstance could limit the external validity of the questionnaire for use in other populations. From a demographic point of view, the sample in our study was similar to that of the previous versions and in other languages, with a proportion of women of 73.3% and a mean age of 48.44±17.9 years.
The versions in German and Brazilian Portuguese were also similar to ours in that the patients were recruited consecutively and the sample sizes were 130 and 45 individuals, respectively. The Italian version10 is the one that differs most widely with regard to the methodology employed since, not only did the authors recruit only patients from primary care, they had a sample size of 576 individuals, randomly selected from a population of 20,882 included in 16 lists of general medicine patients. Another difference observed in the Italian version is that it was the only one in which the questionnaires were sent to the participants by postal mail.
Factor Structure of the Graded Chronic Pain ScaleThe 2 factors that were obtained are commonly dealt with in studies on chronic pain that separate the disability associated with the pain, the more relevant of the 2, from the intensity of that pain. In the different adaptations, these factors have been referred to as the “disability score” and “characteristic pain intensity”, as is the case in the validation of the German version of the questionnaire,11 the validation of the Italian version concerning musculoskeletal disorders10 and the validation of the Portuguese version.12 On the other hand, in a report from the United Kingdom, only 1 factor appeared.30 The latter finding was in line with the original version by von Korff, the Chronic Pain Grade Questionnaire (1992), as it presents a categorical proposal with 4 levels pertaining to the same pain-disability continuum.
The results of our study should be examined with caution until the 1-factor or 2-factor structure of the Spanish adaptation of the GCPS can be validated, in a sample of more than 200 patients and using confirmatory factor analysis. Future studies should also assess the function of the GCPS in populations with different diseases and of different ages.
Clinical ImplicationsThe validation of the GCPS, like the versions in German and in Brazilian Portuguese, was performed in primary care patients with musculoskeletal pain,11,12 which predisposes it for use mainly at that level of health care.
Moreover, the 2-factor model used in this scale is commonly employed in the study of chronic pain.18,33,34
One recommendation at the present time is the development of international collaborative networks, which improve the tools we have for patient evaluation and treatment.35 The presentation of a new version of this scale in the Spanish language will facilitate the development of joint international research in English, German, Italian, Portuguese and Spanish-speaking populations.
LimitationsThe study has a number of limitations that must be taken into account in future research. One of them is the fact that the patients were recruited consecutively, without randomization, a circumstance that may have modified the results of the investigation. Another limitation is the inclusion only of patients with a diagnosis of chronic low back pain, which may affect the external validity of the questionnaire for use in other populations, depending on age and diagnosis. We also consider the use of a 2-dimensional questionnaire to be a possible limitation of the study, taking into account that an important group of experts in methods, measurements and evaluation of pain recommend multidimensional tools (up to 6 dimensions) for its assessment,36 a modification that would require considerably longer questionnaires.
We think that future studies, using prospective, longitudinal intervention designs, will need to examine responsiveness and other analyses complementary to tests of significance.
With respect to the sample size, the inclusion of 75 patients may be a limitation. Some authors recommend approximately 10 individuals for each item in the scale,18 which would have meant raising the number of participants to a total of 80; however, other authors have reported that the study could be carried out in a smaller population without affecting the results.37
ConclusionThe results indicate that the Spanish version of the GCPS is reliable and valid as a short, dynamic and useful instrument to be utilized in clinical practice and research in a Spanish population with chronic low back pain.
Ethical DisclosuresProtection of human and animal subjectsThe authors declare that no experiments were performed on humans or animals for this study.
Confidentiality of dataThe authors declare that no patient data appear in this article.
Right to privacy and informed consentThe authors declare that no patient data appear in this article.
Conflicts of InterestThe authors declare they have no conflicts of interest.
The authors thank Prof. Laura Velasco Matarranz, physical therapist at Centro de Salud Ángela Uriarte in Madrid, for her collaboration and support by facilitating our access to the patients in the physical therapy unit of this center.
The following are the supplementary data to this article:
Please cite this article as: Ferrer-Peña R, Gil-Martínez A, Pardo-Montero J, Jiménez-Penick V, Gallego-Izquierdo T, La Touche R. Adaptación y validación de la Escala de gradación del dolor crónico al español. Reumatol Clin. 2016;12:130–138.


