


The type of body composition modulates the severity of some musculoskeletal conditions, in fibromyalgia syndrome (FMS), this type of association remains relatively unexplored.
ObjectiveTo analyze the association between the type of body composition and FMS using Principal Component Analysis (PCA). The FMS clinical outcome measures were: Symptom Severity Scale (SSS), Widespread Pain Index (WPI; and Fibromyalgia Impact Questionnaire (FIQ).
MethodsForty-three women with FMS (ACR 2010 criteria) were clinically and anthropometrically evaluated. The anthropometric data were integrated into two indicators using a PCA methodology (PCA-Fat and PCA-muscle). Additionally, the patients were classified into high and low categories for each clinical indicator, which were used as dependent variables in binomial logistic regression (BLR) models.
ResultsWe found a positive correlation between PCA-Fat with WPI (r=0.326, P=.043) and FIQ (r=0.325, P=.044), and negative correlation (r=−0.384, P=.013) between PCA-muscle and SSS. In the BLR analysis, PCA-Fat was a significant predictor for high WPI (OR=2.477, P=.038); while for high SSS, PCA-muscle (OR=0.303, P=.009) was an inversely significant predictor.
ConclusionsThe results suggest that the volume of fat mass can negatively modulate the severity of FMS. We propose that the evaluation of body composition should be a basic element for the clinical approach of patients with FMS.
El tipo de composición corporal modula la gravedad de algunos padecimientos musculoesqueléticos; en el síndrome de fibromialgia (SFM) este tipo de asociación permanece relativamente inexplorado.
ObjetivoMediante análisis de componentes principales (PCA), analizar la asociación entre el tipo de composición corporal y medidas de desenlace clínico del SFM, como la Escala de Gravedad de Síntomas, el Índice de Dolor Generalizado y el Cuestionario de Impacto de la Fibromialgia.
MétodosCuarenta y tres mujeres con SFM (criterios ACR 2010) fueron evaluadas clínica y antropométricamente. Los datos antropométricos se integraron en 2 indicadores mediante una metodología de PCA (PCA-Fat y PCA-Muscle). Adicionalmente, las pacientes se clasificaron en categorías alta y baja para cada indicador clínico, los cuales se utilizaron como variables dependientes en modelos de regresión logística binomial.
ResultadosEncontramos correlación positiva entre PCA-Fat, el Índice de Dolor Generalizado (r=0,326, p=0,043) y el Cuestionario de Impacto de la Fibromialgia (r=0,325, p=0,044), y correlación negativa (r=−0,384, p=0,013) entre PCA-Muscle y la Escala de Gravedad de Síntomas. En el modelo de regresión logística binomial, PCA-Fat fue un predictor significativo para un Índice de Dolor Generalizado alto (OR=2,477, p=0,038), mientras que para una Escala de Gravedad de Síntomas alta, PCA-Muscle (OR=0,303, p=0,009) fue un predictor inversamente significativo.
ConclusionesLos resultados evidencian que el volumen de masa grasa puede modular negativamente la gravedad del SFM. Proponemos que la evaluación de la composición corporal debe ser un elemento básico para el abordaje clínico de los pacientes con SFM.
Fibromyalgia syndrome (FM) is a frequent disorder in the general population, especially in young and middle-aged women, and one of the main reasons for seeking care in centers devoted to musculoskeletal medicine.1 Although there is no full agreement on the prevalence of this impairing disorder, its estimates range from 0.2% to 11% according to a meta-analysis published in 2017.2 FM is characterized by the presence of a wide range of symptoms in which generalized musculoskeletal pain, hyperalgesia, fatigue, and non-restorative sleep predominate; besides, cognitive alterations as well as mood disorders. Regarding body composition and its role in FM, altered parameters, mainly characterized by an increase in fat mass, result in states of pro-inflammatory activation which originate from the release of inflammation-mediating and pain-modulating hormones and cytokines characteristic of typical phenomena in hyper-adiposity states.3 Additionally, there is suggestive evidence that the presence of overweight and obesity negatively modulate the response to treatment, the functional prognosis, and the painful clinical picture in inflammatory musculoskeletal conditions such as rheumatoid arthritis,4 psoriatic arthritis5 and, in those with a pauci-inflammatory etiopathogenesis, such as osteoarthritis of the hands, knees, and hips.6
Since at least part of the pathogenesis of FM appears to be influenced by impaired regulation of pain modulating cytokines,7 both centrally and peripherally, the hypothesis that body composition can modulate the symptomatic context of fibromyalgia syndrome is perfectly plausible, although the results coming from studies devoted to the topic are contradictory as it will be briefly explained. For example, a paper reported non-significant differences between FM subject groups who were assessed as “normal” and “high” fat levels,8 but others found significant direct correlation between fat or body mass index (BMI), and pain or Fibromyalgia Impact Questionnaire (FIQ) score.9 In this regard, another report did not find significant associations between BMI and fat mass in FM patients who were on a Mediterranean diet.10
In the present report, we analyzed some body composition variables and their relationship with clinical manifestation of the FM in terms of Symptoms Severity Scale (SSS), Widespread Pain Index (WPI), and Fibromyalgia Impact Questionnaire (FIQ). Furthermore, we incorporated a Principal Component Analysis (PCA) method to bring together several parameters into one variable which displays a unique score for those measurements related to body composition, either for fat or muscle mass, as well as a PCA score for clinical severity.
Materials and methodsParticipantsAn observational, quantitative, cross-sectional study was carried out through a non-random selection of subjects with a diagnosis of FM. The participants were selected and invited in a sequential assignation, through the Rheumatology outpatient clinic from the Yucatán's Peninsula High Specialties Regional Hospital. The inclusion criteria were: female sex, age older than 18 years, having been diagnosed with FM according to the published ACR 2010 classification criteria,11 performed by a certified rheumatologist. Subjects with conditions that could modify body composition resulting in physiological wasting (cancer, chronic infections, poorly absorbed digestive disorders, etc.), besides individuals who withdrew their informed consent and/or could not be interviewed or were unable to be evaluated for anthropometric measurements were excluded.
Socio-demographic and clinical characteristics surveyStudy subjects underwent a clinical interview where all relevant socio-demographic and clinical data, including date of birth, marital status, educational status, current occupational status, menopausal status, pharmacological treatment, physical activity, gravidity, and parity were collected.
FM status assessmentThe evaluation of the clinical FM indicators was carried out using three scores: Widespread Pain index (WPI); Symptoms Severity Scale (SSS); and the Fibromyalgia Impact Questionnaire (FIQ), as established in the National Clinical Practice Guidelines (MEX).12 In the case of WPI, we used the version that comprises 19 anatomical areas (shoulders, arms, forearms, jaws, neck, buttocks, legs, calves, upper back, lower back, thorax, and abdomen) as a continuous scale count of painful regions.13 A complete SSS questionnaire was applied to participants, scoring the levels of severity and other somatic symptoms (sections A and B, respectively). The result was the sum of the elements as reported by the modified ACR 2010 criteria, and referenced from an updated report.14 To assess the FM-related symptoms on the physical and mental health of patients we used the Spanish validated and updated version of the FIQ,15 where the total integrates the sum of all subscales, with higher scores indicating a negative impact (0–100).
Anthropometric measurementsThe body composition assessment included weight, height, body fat percentage (FM%), lean mass percentage (MM%), visceral fat, waist, arm, and hip girths, and skinfold thickness (biceps and triceps). Also, other five calculated scores were recorded: BMI, waist/hip ratio (W/H), Relative Fat Mass (RFM),16 waist-to-height ratio (W/Ht), and Muscle Mass estimation (MMest).17 The measurements were taken according to the Official Mexican Norm by a single researcher (LOC), who is a qualified expert for Clinical Nutrition, trained in anthropometry procedures. All anthropometric measurements were obtained the same day as the clinical interview, using a portable device body composition monitor and scale (OMRON Healthcare Co. LTD. Japan) without shoes and light clothes (approximated to the nearest 0.1kg). Height was measured using a Harpenden stadiometer (Holtain 602VR®) to the nearest 0.5cm, with participants again not wearing shoes. Determination of skinfold thickness was performed to the nearest 0.1mm at the triceps and on the right side using a Harpenden standard Slim Guide skinfold caliper (TAQ Sistemas Médicos S.A. de C.V, Mexico). All skinfold measurements were performed in triplicate, and the average of the three readings was annotated. They were carried out on the right side of the body on all subjects assuming a relaxed standing position with the arms hanging by the side and according to the validated methods.18
Principal component analysisA dimension reduction was carried out with a PCA procedure, obtaining scores (coefficients) as a new variable for each participant that was used to perform comparisons and correlations. Those scores integrated parameters for fat and lean mass content, and FM clinical indicators (WPI, SSS, and FIQ). A correlation matrix was constructed to assess the correlation between anthropometric measures. The Kaiser–Meyer–Olkin test for sampling adequacy (≥ 0.6) and Bartlett's test of sphericity (P value<.05) were verified to validate whether the PCA assumptions were fulfilled. Varimax rotation was applied to obtain orthogonal factors. Fat and lean/muscle mass groups that showed factor loadings greater than 0.3 were considered to have strong associations with that factor. The number of factors that best represent the data was based on the screen plot and eigenvalues which reached a value above 1.5. To establish the internal consistency and the correlation between the variables and loaded components, we ran a Cronbach's alpha, which displayed values>0.7, displaying an acceptable level of internal consistency. The variables comprised for each PCA group (PCA-Fat, PCA-Muscle), are found in Table 1.
Variables loaded on PCA components to score for fat or muscle parameters.
| PCA-Fat component | PCA-Muscle component |
|---|---|
| BMI | BMI |
| FM % | Weight |
| FM kg | MM% |
| Hip girth | MM kg |
| Arm girth | W/Ht |
| Biceps sf | MMest |
| Triceps sf | |
| Cronbach's α=0.903 | Cronbach's α=0.739 |
BMI=body mass index, FM=fat mass, MM=muscle mass, sf=skinfold, W/Ht=waist-to-height ratio, MMest=estimated muscle mass.
Every variable was tested for data distribution, and normality was assessed with Shapiro–Wilk's test. Clinical indicators were categorized as “Low” or “High” groups for each of the FM clinical indicator (WPI, SSS, and FIQ) depending on individual scores, unique sequential ranks, and tied observations. The descriptive data for these categorical variables are specified in Table 2. Additionally, we examined three Binomial Logistic Regression (BLR) models, using those categorical variables (Low and High groups) as dependent variables for each model. The BLRs were accomplished by using the method “enter,” with body composition parameters, age, and other covariates like comorbidities or pharmaceutical treatment as predictor variables. Significant models were tested for multicollinearity and Interactions between included covariates which was based on the rule of ≥10 events per variable and were those of interest to body composition (PCA-Fat, PCA-muscle), and age since it seems to play a role in FM. For all hypothesis tests, P value was considered as significant if it was <.05. The analysis was carried out using IBM® SPSS® Statistics, v. 24 for Windows.
Sociodemographic and clinical data of participants.
| Numerical variables | Mean | S.D. | Min. | Max. | 95% C.I. | Categorical variables | n | % | |
|---|---|---|---|---|---|---|---|---|---|
| Lower | Upper | ||||||||
| General information | BMC categories | ||||||||
| Age (y) | 52.7 | 11.3 | 21 | 75 | 49.2 | 56.2 | Normal | 4 | 9.3 |
| Evol (mo) | 97.9 | 75.0 | 4 | 264 | 74.9 | 121 | Overweight | 19 | 44.2 |
| Diag (mo) | 53.6 | 54.1 | 0 | 192 | 36.9 | 70.2 | Obesity | 20 | 46.5 |
| FMS clinical indicators | Comorbidities | ||||||||
| WPI | 10.6 | 4.3 | 1.0 | 19.0 | 9.3 | 11.9 | None | 16 | 37.2 |
| SSS | 7.7 | 3.0 | 0.0 | 12.0 | 6.5 | 8.4 | DM2 | 3 | 6.9 |
| FIQ | 51.3 | 15.2 | 16.0 | 74.4 | 46.6 | 55.9 | AHT | 6 | 14.0 |
| Body composition parameters | PAD | 3 | 6.9 | ||||||
| Wt (kg) | 69.7 | 12.4 | 44.6 | 112 | 65.9 | 73.5 | DLP | 2 | 4.7 |
| Ht (cm) | 152.5 | 6.6 | 136 | 170 | 150.4 | 154.5 | Mixed | 9 | 20.9 |
| BMI (kg/cm2) | 29.8 | 4.1 | 21.7 | 38.8 | 28.6 | 31.1 | Resp | 4 | 9.3 |
| Hip girth (cm) | 109.4 | 9.9 | 88.0 | 133.5 | 106.4 | 112.5 | Pregnancies | ||
| Arm girth (cm) | 35.3 | 4.5 | 29.0 | 47.5 | 33.9 | 36.7 | 0–1 | 9 | 21 |
| Waist girth (cm) | 94.4 | 9.8 | 78.5 | 120.5 | 91.4 | 97.4 | 2–3 | 20 | 46 |
| W/H | 0.9 | 0.1 | 0.7 | 1.0 | 0.8 | 0.9 | 4–6 | 14 | 33 |
| BSF (mm) | 13.5 | 5.0 | 6.0 | 27.0 | 11.9 | 15.1 | Physical activity | ||
| TSF (mm) | 20.9 | 5.3 | 13.0 | 35.0 | 19.2 | 22.5 | No | 25 | 58 |
| Fat (%) | 44.1 | 8.4 | 0.0 | 56.0 | 41.6 | 46.7 | Yes | 18 | 42 |
| Visceral fat (%) | 9.6 | 2.7 | 0.0 | 14.0 | 8.7 | 10.4 | Educational level | ||
| Fat (kg) | 32.1 | 8.9 | 14.9 | 60.5 | 29.4 | 34.9 | Basic | 17 | 40 |
| Lean mass (%) | 22.8 | 1.7 | 18.7 | 26.3 | 22.3 | 23.4 | HS, College | 12 | 28 |
| Lean mass (kg) | 15.9 | 2.3 | 10.8 | 22.8 | 15.2 | 16.6 | BSc, Postgr | 14 | 33 |
| RFM (%) | 42.4 | 7.3 | 0.0 | 48.4 | 40.2 | 44.6 | |||
| W/Ht | 0.6 | 0.1 | 0.5 | 0.7 | 0.6 | 0.6 | |||
| MMest (kg) | 16.3 | 3.8 | 3.1 | 28.0 | 15.1 | 17.4 | |||
| Pharmacological treatment | n | % | n | % | |
|---|---|---|---|---|---|
| Analgesic | Anti-depressant | ||||
| None | 13 | 30.2 | None | 16 | 37.2 |
| NSCOX2 | 21 | 48.8 | SNRIs | 9 | 20.9 |
| SCOX2 | 6 | 14 | SSRIs | 12 | 27.9 |
| Mixed | 3 | 7 | Benzod | 2 | 4.7 |
| Opioids use | Mixed | 4 | 9.3 | ||
| No | 30 | 69.8 | Others | ||
| Yes | 13 | 30.2 | None | 23 | 53.5 |
| Cyclo-benzaprine | Metfor | 3 | 7.0 | ||
| No | 37 | 86.0 | AntiAHT | 3 | 7.0 |
| Yes | 6 | 14.0 | Misc. | 6 | 14.0 |
| GABAergic | Mixed | 8 | 18.5 | ||
| None | 20 | 46.5 | |||
| Gabapentine | 7 | 16.3 | |||
| Pregabalin | 16 | 37.2 | |||
WPI=Widespread Pain Index, SSS=Severity Symptoms Scale, FIQ=Fibromyalgia Impact Questionnaire, BMI=Body Mass Index, W/H=Waist to Hip ratio, BSF=Bicipital Skinfold, TSF=Tricipital Skinfold, RFM=Relative Fat Mass, W/Ht=Waist to Height ratio, MMest=Muscle mass estimated, y=years, mo=months. DM2=Diabetes mellitus 2, AHT=Arterial hypertension, PAD=Peptic acid disease, DLP=Dyslipidemia, Resp=Respiratory (allergies, asthma), HS=High School, Postgr=Postgraduate. NSCOX2=Non selective COX2 inhibitor, SCOX2=Selective COX2 inhibitor, SNRIs=Serotonin-norepinephrine reuptake inhibitor, SSRIs=Selective serotonin reuptake inhibitors, Benzod=Benzodiazepine, Metfor=Metformin, AntiAHT=AntihypertensivesMIsc.=Miscellaneous (Statins, antihistaminic, vit B complex, omeprazole).
The research protocol was approved by the Research and Bioethics Committees of the participating unit. All participants signed the informed consent letter before entering the study. Subjects in whom alterations in body composition were detected received nutritional counseling and were referred to nutritional care or mental health according to their condition.
ResultsCharacteristics of the subjectsForty-three patients, all women, who were 52.7±11.3 years old (limits: 21–75), had FM diagnosis since 53.6±54 months (limits: 0–192), besides 89±75 months (limits: 4–264) FM duration were included. Most of the patients were taking some form of medication such as NSAIDs (n=30, 65%), opioids (n=13, 28%), and antidepressants or benzodiazepines (n=27, 62% combined). Also, there was a high prevalence of overweight/obesity (90.7%), and most of them had some kind of comorbidity (62.7%). Complete descriptive data can be found in Table 2.
FM clinical indicators and PCA componentsFirstly, the relationship between clinical indicators (WPI, FIQ, SSS) and body composition was determined using Pearson (WPI, FIQ) and Spearman correlation (SSS) according to the data distribution. The scores for fat and muscle were composed of the PCA components that integrated measurements for anthropometry and fat or muscle determinations. The results showed a statistically significant positive correlation between PCA-Fat and two of the clinical parameters: WPI (r=.326, P=.043) and FIQ (r=.325, P=.044) (Fig. 1A, B respectively), but no significance was achieved for SSS. On the contrary, for PCA-muscle the significance was demonstrated only for SSS, with a negative coefficient correlation (r=−.384, P=.013) (Fig. 1C).
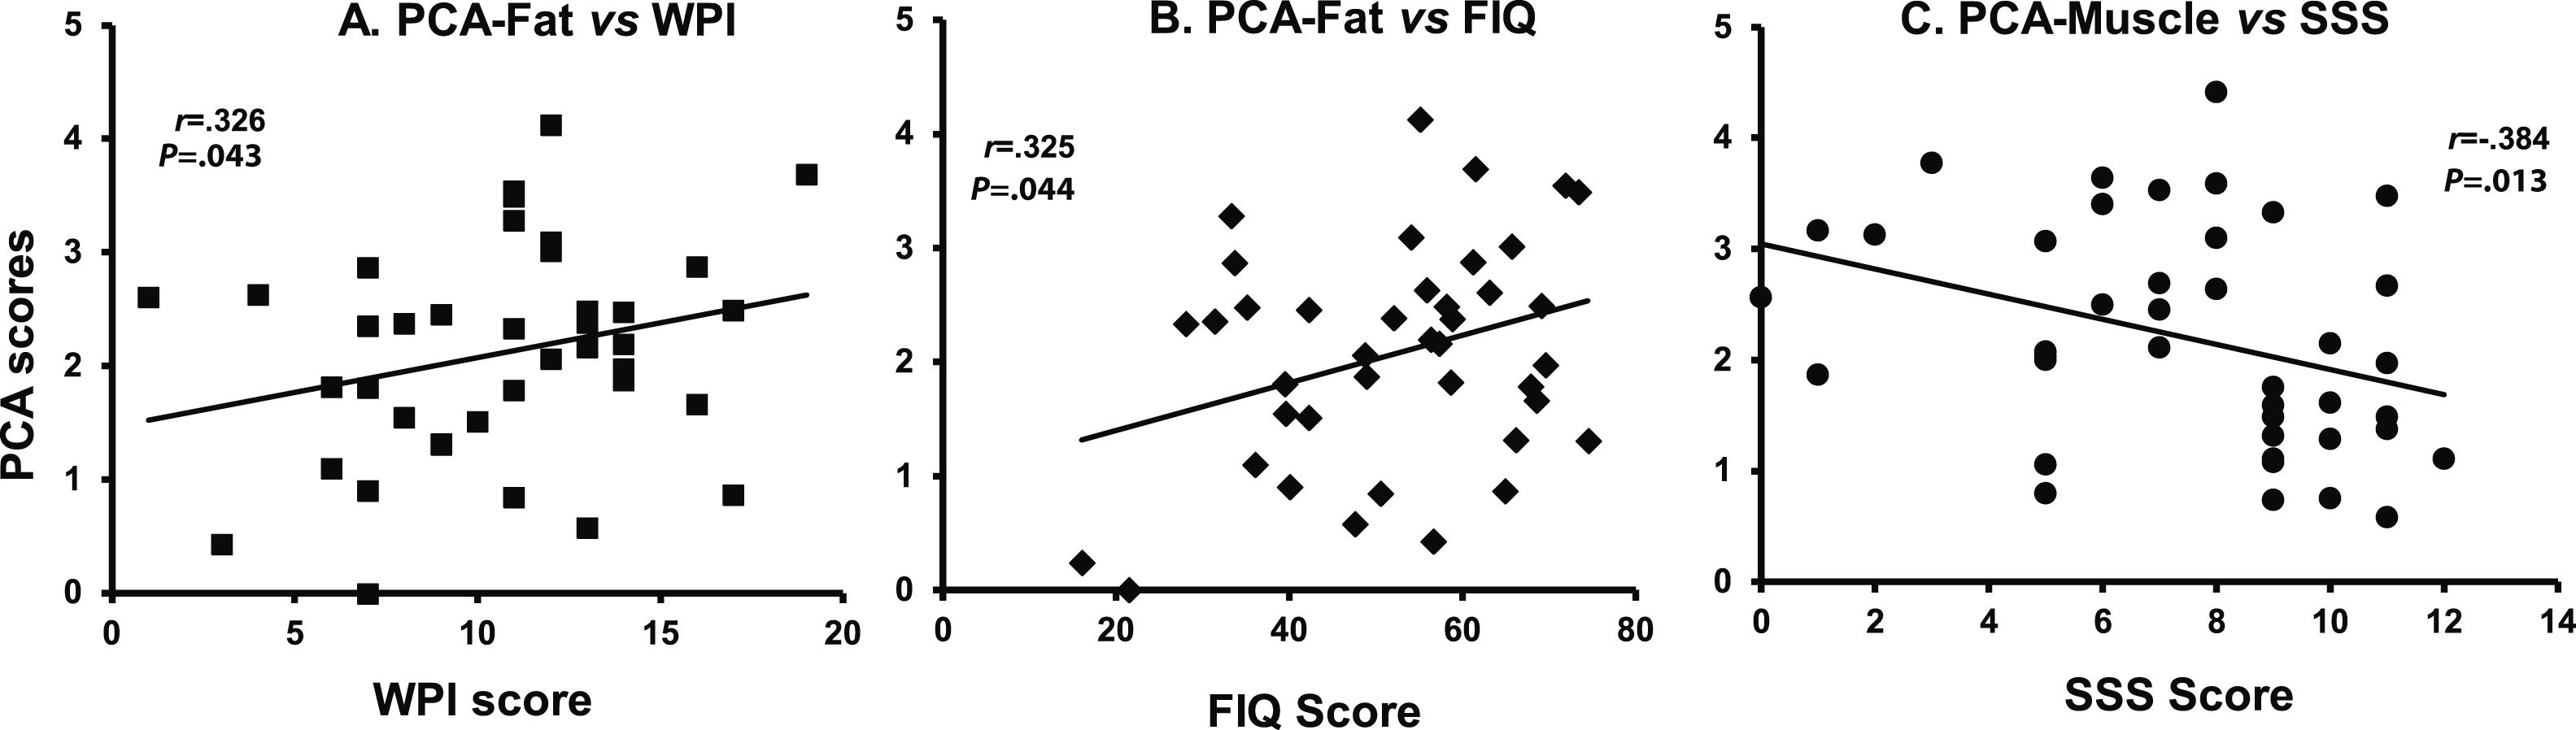 .05). Bivariate Pearson's correlation established a statistically significant, moderate positive correlation between the scores tested, r=.326, P<.05. (B) The relationship was linear with both variables normally distributed, as assessed by Shapiro–Wilk's test (P>.05). There was a statistically significant, moderate positive correlation between the scores tested, r=.325, P<.05. (C) A Spearman's rank-order correlation was run to assess the relationship between PCA-Muscle and SSS scores. Preliminary analysis showed he relationship to be monotonic, as assessed by visual inspection of a scatterplot. There was a statistically significant, moderate negative correlation between those two variables, rs=−.384, P<.05.' title='Correlation analyses between PCA-Fat and WPI scores, FIQ scores, and PCA-Muscle and SSS scores. (A) Preliminary analysis showed the relationship to be linear with both variables normally distributed, as assessed by Shapiro–Wilk's test (P>.05). Bivariate Pearson's correlation established a statistically significant, moderate positive correlation between the scores tested, r=.326, P<.05. (B) The relationship was linear with both variables normally distributed, as assessed by Shapiro–Wilk's test (P>.05). There was a statistically significant, moderate positive correlation between the scores tested, r=.325, P<.05. (C) A Spearman's rank-order correlation was run to assess the relationship between PCA-Muscle and SSS scores. Preliminary analysis showed he relationship to be monotonic, as assessed by visual inspection of a scatterplot. There was a statistically significant, moderate negative correlation between those two variables, rs=−.384, P<.05.'/>
Correlation analyses between PCA-Fat and WPI scores, FIQ scores, and PCA-Muscle and SSS scores. (A) Preliminary analysis showed the relationship to be linear with both variables normally distributed, as assessed by Shapiro–Wilk's test (P>.05). Bivariate Pearson's correlation established a statistically significant, moderate positive correlation between the scores tested, r=.326, P<.05. (B) The relationship was linear with both variables normally distributed, as assessed by Shapiro–Wilk's test (P>.05). There was a statistically significant, moderate positive correlation between the scores tested, r=.325, P<.05. (C) A Spearman's rank-order correlation was run to assess the relationship between PCA-Muscle and SSS scores. Preliminary analysis showed he relationship to be monotonic, as assessed by visual inspection of a scatterplot. There was a statistically significant, moderate negative correlation between those two variables, rs=−.384, P<.05.
We performed t test for independent samples, using the operational groups created from the sequential ranks, and each numerical variable. These groups are namely “Low” and “High” for WPI, SSS, and FIQ. Independent samples t test confirmed significant differences as follows: higher values of triceps sf (P=.038) and PCA-Fat score (P=.009) for High-WPI group (Fig. 2A, B respectively). As for SSS groups, individual significant differences between High-SSS and Low-SSS were observed, with higher values of BMI (P=.007), waist girth (P=.029), RFM (P=.017), W/Ht (P=.001) (Fig. 3A–D), and PCA-muscle scores (P=.001) for the Low-SSS group (Fig. 3E), but no differences were found for the global PCA-Fat score. It is noteworthy to mention that there was also a significant difference in age between High and Low-SSS, being higher for the latter (P=.040) (Fig. 3F). For the groups of High-FIQ and Low-FIQ there were no significant differences.
 (A) and PCA-Fat scores (B), were significantly higher in High-WPI group (P=.038 and P=.009, respectively). Data are mean±standard error of the mean.")
Low and High-WPI group comparisons. Independent-samples t-tests were run to determine if there were differences in body composition parameters between Low-WPI and High-WPI groups. Tricipital skinfold thickness (sf) (A) and PCA-Fat scores (B), were significantly higher in High-WPI group (P=.038 and P=.009, respectively). Data are mean±standard error of the mean.
 Body Mass Index (P=.007), (B) Waist girth (P=.029), (C) Relative Fat Mass (P=.017), (D) Waist-to-Height ratio (P=.001), (E) PCA-Fat score (P=.001) were observed in Low-SSS group. (Data are mean±standard error of the mean). (F) The graph displays the distribution of age in both groups, and a significant difference (P=.040) between groups was observed.")
Low and High-SSS group comparisons. Independent-samples t-tests were run to determine if there were differences in body composition parameters between Low-SSS and High-SSS groups. Significantly higher values for (A) Body Mass Index (P=.007), (B) Waist girth (P=.029), (C) Relative Fat Mass (P=.017), (D) Waist-to-Height ratio (P=.001), (E) PCA-Fat score (P=.001) were observed in Low-SSS group. (Data are mean±standard error of the mean). (F) The graph displays the distribution of age in both groups, and a significant difference (P=.040) between groups was observed.
Two models in which the dependent variables were established as Low/High correspondingly for WPI and SSS tested statistically significant when PCA-muscle, PCA-Fat, and age were entered as covariates (Table 3). These models were statistically significant as follows: model Low/High WPI, X2(3)=7.854, P=.049; model Low/High SSS, X2(3)=16.575, P=.001, explained 24.5%, and 46.2%, of the variance (based on Nagelkerke R2) and correctly classified 66.7%, and 76.9%, of cases for models WPI and SSS, respectively. No multicollinearity was detected in any of the models using variance inflation factor (VIF) and tolerance. This is, none of the variables included in the models showed a VIF less than 3, all tolerance values were higher than 0.2, the condition indexes were smaller than 15, and there were not two or more variables with an eigenvalue greater than 0.90. The two models showed that at least one predictor was significant for the corresponding outcome. In the case of Low/High WPI as the dependent variable, the PCA-Fat score was a significant predictor (OR=2.477, 95% CI 1.052–5.832), in which an increasing PCA-Fat score is associated with an increased likelihood of exhibit high WPI. For the model with Low/High SSS as the dependent outcome, the PCA-Muscle score was the only significant predictor (OR=0.303, 95% CI 0.123–0.745), but in this case, this covariate showed to be a protective factor for High-SSS. The areas under the ROC curve (Fig. 4) were 0.735 (95% CI, 0.580–0.891, P=.013), and 0.850 (95% CI, 0.731–0.969, P<.001), respectively for Low/High-WPI and Low/High-SSS, respectively.
Categorical variables defined for FMS clinical indicators, and Binomial Logistic regression models.
| FMS clinical indicators categories | |||||
|---|---|---|---|---|---|
| n | Mean | S.D. | Minimum | Maximum | |
| Widespread Pain Index (WPI) | |||||
| Low-WPI | 19 | 6.42 | 2.50 | 1 | 10 |
| High-WPI | 24 | 13.58 | 2.52 | 11 | 19 |
| n | Mean | S.D. | Minimum | Maximum | |
| Symptoms Severity Scale (SSS) | |||||
| Low-SSS | 23 | 5.26 | 2.38 | 0 | 8 |
| High-SSS | 20 | 10.00 | 0.973 | 9 | 12 |
| n | Mean | S.D. | Minimum | Maximum | |
| Fibromyalgia Impact Questionnaire (FIQ) | |||||
| Low-FIQ | 21 | 38.54 | 10.67 | 16 | 54 |
| High-FIQ | 22 | 63.42 | 6.03 | 55 | 74 |
| Binary logistic regression models | ||||
|---|---|---|---|---|
| Model | Variables | Odds ratio | 95% CI | P value |
| High/Low WPIOmnibus test of model coefficients: 0.049Hosmer–Lemeshow test: 0.732 | PCA-Fat | 2.477 | 1.052–5.832 | .038* |
| PCA-Muscle | 1.008 | 0.471–2.156 | .984 | |
| Age | 0.970 | 0.896–1.049 | .445 | |
| Intercept | 6.615 | .375 | ||
| High/Low SSSOmnibus test of model coefficients: 0.001Hosmer–Lemeshow test: 0.340 | PCA-Fat | 0.696 | 0.271–1.784 | .450 |
| PCA-Muscle | 0.303 | 0.123–0.745 | .009* | |
| Age | 0.914 | 0.826–1.012 | .084 | |
| Intercept | 94.07 | |||
. AUC for A) Low/High-WPI was 0.735 (95% CI, 0.580–0.891, P=.013), and AUC for B) Low/High- SSS was 0.850 (95% CI, 0.731–0.969, P<.001).")
The comparisons involving all groups of medical treatment, displayed significant differences when the factor was the use of cyclobenzaprine with SSS higher scores for those who registered a continuous use of this medication (P=.025) (Fig. 5A), however that group was composed of only 6 patients. In the case of FIQ, we found significantly higher scores for the group that reported to have used GABA agonists (gabapentin and pregabalin groups, P=.022), and more specifically for pregabalin compared to the group that did not report any of this medication (P=.026) (Fig. 5B).
 A Mann–Whitney U test was run to determine differences in SSS score between cyclobenzaprine use (yes/no). SSS score was statistically significantly higher in the group under this drug than in those who denied it, U=47.5, z=−2.243, P=.025, using an exact sampling distribution for U. (B) One-way ANOVA with subsequent post hoc tests (Tukey HSD), among different groups under GABAergic medication showed higher scores of FIQ in the patients under pregabalin treatment (P=.026).")
Pharmacological treatment group comparisons. (A) A Mann–Whitney U test was run to determine differences in SSS score between cyclobenzaprine use (yes/no). SSS score was statistically significantly higher in the group under this drug than in those who denied it, U=47.5, z=−2.243, P=.025, using an exact sampling distribution for U. (B) One-way ANOVA with subsequent post hoc tests (Tukey HSD), among different groups under GABAergic medication showed higher scores of FIQ in the patients under pregabalin treatment (P=.026).
Although the association between body composition and FM has been explored before,8–10 we used a different analytical strategy for this type of studies, that included a dimension joining several parameters for body composition in one unique score, integrated as continuous variables.
Firstly, we found a direct positive correlation, yet moderate but significant, between adiposity (stated as PCA-Fat score), and the clinical parameters WPI and FIQ, but no significant association was found for SSS. Conversely, FIQ was negatively correlated with PCA-Muscle score, but no significant difference was displayed with the other clinical FM indicators. The significant relationship between fat parameters and FM is concordant with other authors19,20 when individual parameters related to adiposity were examined. In this regard, the efforts tend to prove a significant association not only between obesity and severity of the disease, but also between an augmented dietary fat intake that modifies the manifestation, continuation, and sensitivity of chronic musculoskeletal pain specially in older adults.21 In the case of muscle mass, our results indicated that the higher muscle estimations (PCA-Muscle), the lower SSS scores and, unlike the fat implication in FM, there is a limited number of reports dealing specifically with the FM clinical indicators and muscle estimates. However there is a report which showed that localized muscle segment (quadriceps femoris) was inversely correlated with tiredness, quality of life, and energy levels.22 Another study published in 2013 found a significant association between the strength loss (measured as the maximal voluntary isometric contraction) and FIQ scores in a small sample of FM postmenopausal women, but no data on muscle quantities were provided.23
Next, we analyzed clinical indicators which were grouped into two categories (High, Low) using tier ranking classification. Even though we did not find any difference between High- and Low-WPI for individual fat-related parameters, significantly higher scores of the PCA-Fat in the High-WPI group, as well as higher triceps skinfold thickness were showed. This result concurs with other authors20,24 in which total and central body fat had a significant association with pain-related measures (triceps skinfold has been widely accepted as a surrogate measure for peripheral adiposity25) supporting the view that higher pain thresholds are directly related to adiposity. High- and Low-SSS groups also displayed differences between individual body composition parameters (i.e. BMI, RFM, W/Ht), and PCA-muscle score. The Low-SSS group had significantly higher values for those determinations, and also for the age mean, which can explain the elevated values linked to adiposity in that group, since the age is correlated with an increase in BMI and fat parameters (data not shown). It is noteworthy that age difference was not present in the WPI or FIQ groups, and this finding is in agreement with a report published in 2014, in which young (<39 years old) and middle age (40–59 years old) patients, exhibited worse fibromyalgia symptoms than older patients (>60 years old).26 The reason for this could be explained by the fact that the younger FM patients perceive more interference with their life otherwise expected to have a more active lifestyle. Conversely, the lower PCA-Muscle score found in the High-SSS group can be directly related to a reduced muscle strength of limbs however this outcome has not been specifically reported, and we found only a record from 2012 mentions this fact.27 In the case of FIQ groups, we did not find any significant results, nonetheless, it has been reported that obese patients have worse outcomes for this FM clinical indicator.19 However, we should keep in mind that in the present study, a high proportion of our patients have an increased BMI, with a positive relationship between FIQ scores and PCA-Fat score.
Concerning the binomial logistic regression models, analyses showed that PCA scores (Fat and Muscle) were the only predictor that remained significant when age was present. In the case of PCA-Fat, the OR displayed more than twofold probability (2.5) to exhibit higher scores of pain (High-WPI), and the PCA-Muscle score was significantly associated to a decreased probability (0.303) to develop a high SSS score.
The mechanism explaining adipose tissue and FM link is still unclear, however, some molecular and biochemical studies have shed some light on this excruciating disorder with involvement from gut microbiome to other circulating substances (cytokines, micro ARN).28
Concurrently, we found higher FIQ scores in patients under GABAergic treatment, particularly with Pregabalin. This finding might be explained by the blunting of GABA pain inhibition reported in 2015, in which it was reported to be induced by E2-specific regulation, worsening the impact perception of FM.29 In the case of cyclobenzaprine, we consider that the meaning of this finding could be circumstantial and related to the fact that the patients used it to relieve their already elevated severity scores.
As a cautious note, we acknowledge that our sample was only composed of women, since a vast majority of rheumatic diseases are more prevalent in women, reporting higher pain scores, physical and, particularly, emotional complaints.30 Actually, we were able to observe this emotional trait in our group of patients, but no data were recorded for this aspect. In our sample, the overweight and/or obesity prevalence (∼80%) was higher than reported hitherto, a fact that might be linked to the BMI values in our region are moderately above the national average (Mexican National Survey of Health and Nutrition).31
We reckon that the cross-sectional design of our study is not definitive for probing causality, so we understand our results may have generalizability limitations. Additionally, we agree that although our study found an association between body composition and FM clinical severity parameters, some of these correlations might have been modified by the age, perception, and potential depression of the patients. Notwithstanding our limitations, these findings highlight the importance of a further global and integral examination of body composition for each patient who suffers a musculoskeletal disorder to redefine the follow-up, including rigorous nutritional assistance.
ConclusionsOur results strongly suggest that hyper-adiposity states may negatively modulate the clinical severity in FM. Thus, body composition appraisal must be part of the global assessment of FM patients, with mandatory nutritional counseling, and special emphasis in the diet, from which patients can see benefits ranging from reduced anxiety symptoms, mood disturbance, and even disappointment with body image.
This paper supports the notion that fat tissue is a regulator in several realms of the organism and presents evidence suggesting that elevated body fat worsen the outcomes of FM clinical parameters.
Authors’ contributionsJAN designed the study and outlined the driving conceptual ideas; ELPP supervised the whole work, data analysis and main manuscript layout; LLOC generated the primary datasets and performed nutritional assessment. AVRA, JFAM and FERM contributed to data analysis and the standardization of the methodology. All authors provided feedback, read and approved the final manuscript.
FundingThis research did not receive any specific grant from funding agencies in the public, commercial, or not-for-profit sectors.
Conflict of interestThe authors declare that they have no conflict of interest.
We would like to thank all our patients who accepted to be part of this study.


