


To investigate the role of neutrophil to lymphocyte ratio (NLR) and platelet to lymphocyte ratio (PLR) as activity markers in systemic lupus erythematosus (SLE) without nephritis and lupus nephritis (LN) patients.
Patients and methodsThis study included 60 SLE patients with LN, 60 SLE patients without renal involvement and 30 healthy controls. We analyzed correlations between NLR and PLR and both disease activity and renal affection.
ResultsThe NLR of SLE patients was much higher than those of the controls. Both ratios showed significantly increased values in SLE patients with active disease. NLR and PLR were positively correlated with SLEDAI, ESR, and CRP and negatively correlated with C4. SLE patients with LN had higher levels of NLR than those without nephritis. NLR showed positive correlations with BUN, serum urea, serum creatinine and 24h urinary protein. We found NLR to be related to anti-ds-DNA level and renal biopsy classes. While PLR was related only to anti ds-DNA. The best NLR to predict SLE active disease was 2.2 and the best PLR cut-off value was 132.9.
ConclusionNLR and PLR are useful inflammatory markers to evaluate disease activity in SLE patients. Also, NLR could reflect renal involvement in SLE patients and is associated with the different classes of its histological staging.
Investigar el papel de la proporción de neutrófilos a linfocitos (NLR), y la relación de plaquetas a linfocitos (PLR) como marcadores de actividad en el lupus eritematoso sistémico (LES) sin nefritis, y pacientes con nefritis lúpica (NL).
Pacientes y métodosEste estudio incluyó a 60 pacientes con LES con NL, 60 pacientes con LES sin afectación renal y 30 controles sanos. Analizamos las correlaciones entre NLR y PLR con la actividad de la enfermedad y la afección renal.
ResultadosLa NLR de los pacientes con LES fue mucho más alta que los de los controles. Ambas razones mostraron valores significativamente mayores en pacientes con LES con enfermedad activa. La NLR y la PLR se correlacionaron positivamente con SLEDAI, ESR y CRP y se correlacionaron negativamente con C4. Los pacientes con LES con LN tenían niveles más altos de NLR que aquellos sin nefritis. La NLR mostró correlaciones positivas con BUN, urea sérica, creatinina sérica y proteína urinaria de 24h. Encontramos que la NLR está relacionada con el nivel de anti-dsDNA y las clases de biopsia renal. Mientras que la PLR estaba relacionada solo con anti-dsDNA. La mejor NLR para predecir la enfermedad activa del SLE fue de 2,2 y el mejor valor de corte de la PLR fue 132,9.
ConclusiónLa NLR y la PLR son marcadores inflamatorios útiles para evaluar la actividad de la enfermedad en pacientes con LES. Además, la NLR podría reflejar la afectación renal en pacientes con LES y se asocia con las diferentes clases de su estadificación histológica.
Systemic lupus erythematosus (SLE) is a chronic autoimmune inflammatory disease with unknown etiology and diversity of clinical manifestations, course of illness and prognosis.1
Many laboratory parameters can be used to check for disease activity such as low complement and increased deoxyribonucleotide (DNA) binding.2,3
SLE nephritis affects nearly 50% of SLE patients, leading to increasing the risk of renal failure and cardiovascular diseases.4 Early diagnosis and rapid treatment of lupus nephritis are crucial to improve survival in SLE patients.5
Renal biopsy is still the standard investigation to check for suspected flares in lupus nephritis.6 The renal biopsy carries some risks, primarily of bleeding resulting in perirenal hematoma and blood transfusion.7
Searching for simple laboratory indicators that are available in almost every healthcare facility to evaluate disease activity and renal affection in SLE patients is an important issue.
The type of circulating WBCs exhibits certain changes in systemic inflammation, which is mainly characterized by neutrophilia and lymphopenia. In SLE, lymphopenia is the most frequent WBC abnormality and is found in up to 93% of SLE cases.8 During disease activity, neutrophilia and lymphopenia can be present in higher levels. Moreover, lupus neutrophils cannot be cleared by the C1q/calreticulin/CD91-mediated apoptotic pathway, leading to the accumulation of neutrophils.9
Platelet system activation is a key event in the pathogenesis of SLE. Circulating immune complexes, anti-phospholipid antibodies and infectious agents such as virus are the main activators of platelets in SLE.10
Authors use changes in peripheral blood cell components to detect disease activity in some collagen tissue diseases such as rheumatoid arthritis,11,12 systemic lupus erythematosus13,14 and systemic sclerosis.15
Neutrophil to lymphocyte ratio (NLR) and platelet to lymphocyte ratio (PLR) are two of the complete blood count parameters. A high NLR is used as an inflammatory marker for different autoimmune diseases such as primary Sjögren's syndrome (PSS),16 psoriasis17 and ulcerative colitis.18
High PLR has been used as a marker for differential diagnosis or prognostic prediction of different diseases such as cancer and inflammatory diseases.19
Qin et al., found NLR to be related to SLE disease activity.14 Li et al., have reported NLR as a marker for SLE nephritis.20 Wu et al., found an association between both NLR and PLR and SLE disease activity and an increase for NLR only in LN patients.21 Ayna et al., reported NLR cut off value of 1.93 to differentiate SLE patients with or without nephritis.22
Therefore, we aimed for the present study to correlate NLR and PLR and both disease activity and renal affection.
Patients and MethodsIn this cross-sectional study we enrolled 120 adult patients with SLE who were recruited in the Department of Physical Medicine, Rheumatology & Rehabilitation (AIN Shams University, Cairo) between January 2016 and March 2017. The Ethical Committee of Ain Shams University approved this study, and all patients signed an informed consent before participation.
All SLE patients were newly diagnosed without treatment based on the American College of Rheumatology criteria.23 Patients who had active infections, malignancies, lymphoproliferative disorders, hematologic diseases, other autoimmune diseases, hepatosplenic diseases and diabetic nephropathy were excluded. We evaluated SLE disease activity using the SLEDAI score.24 Patients with a score ≤4 were considered inactive. While those with a score >4 were considered active. 60 out of the 120 patients were diagnosed as lupus nephritis based on clinical and laboratory manifestations that meet the ACR criteria. We confirmed the diagnosis of renal involvement in those patients by renal biopsy. We classified the biopsies according to World Health Organization classification.25 The majority of our patients were in classes III and IV (17 and 13 patients, respectively), 12 patients were in class II, 12 patients were in class V and 6 were in class VI. None of the 60 patients were in class I.
Besides, we enrolled 30 ages and gender-matched healthy subjects without any diseases as the control group. The ethical committee of Ain Shams University had approved this study, and we took a written informed consent from all patients.
Laboratory AnalysesWe collected blood samples from participants after they had fasted overnight. We performed laboratory evaluations, including CBC and tests of erythrocyte sedimentation rate (ESR), C-reactive protein (CRP), serum urea, blood urea nitrogen (BUN), serum creatinine and 24h urinary protein, using standard laboratory methods. In addition, we analyzed anti-ds-DNA, C3 and C4 using standard methods. We performed all laboratory analyses on the same day within 1h after the collection of samples. We calculated the NLR and PLR from the CBC results.
Statistical AnalysisWe carried out statistical analysis via IBM SPSS version 20 for Windows (IBM Corporation, Armonk, NY, USA). We used Student's t-test or Mann–Whitney U test to compare two independent groups according to distribution status. Furthermore, we used Chi-square test to show the association with variables for categorical data.
We performed analysis of variance (ANOVA) to test the difference between mean values of some parameters among multiple groups. We presented correlations between two variables using the Spearman or Pearson correlation coefficient. We analyzed the receiver operating characteristic curve (ROC) to find the discrimination values of NLR and PLR for SLE patients with or without activity and for those with or without nephritis. A value of P<.05 was considered to be statistically significant for all values.
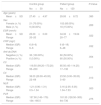
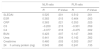
ResultsDemographic data and laboratory findings of 120 SLE patients and 30 healthy controls are shown in Table 1. NLR showed statistically significant increased values of SLE patients as compared to control group (P=.000). While PLR showed a non-significantly increased value (P=.275).
Comparison Between Control and Patient Groups Regarding Demographic and Laboratory Data.
| Control group | Patient group | P-Value | |
|---|---|---|---|
| No=30 | No=120 | ||
| Age (years) | |||
| Mean±SD | 27.40±4.97 | 29.93±8.72 | .385 |
| Sex | |||
| Female (n, %) | 21 (70.00%) | 102 (85.00%) | .269 |
| Male (n, %) | 9 (30.00%) | 18 (15.00%) | |
| ESR (mm/h) | |||
| Mean±SD | 20.00±0.00 | 34.33±19.04 | .022 |
| Range | 20–20 | 20–77 | |
| CRP (mg/l) | |||
| Median (IQR) | 6 (6–6) | 6 (6–18) | .032 |
| Range | 6–6 | 6–48 | |
| Anti-ds DNA | |||
| Negative (n, %) | 30 (100.00%) | 60 (50.00%) | .004 |
| Positive (n, %) | 0 (0.00%) | 60 (50.00%) | |
| C3 | |||
| Median (IQR) | 118.50 (99.20–173.20) | 85.50 (45–114.25) | .011 |
| Range | 95–200 | 17–190 | |
| C4 | |||
| Median (IQR) | 36.00 (29.00–45.00) | 23.50 (9.00–35.00) | .013 |
| Range | 22–69 | 3–60 | |
| NLR | |||
| Median (IQR) | 1.21 (0.90–1.31) | 3.16 (2.05–5.05) | .000 |
| Range | 0.5–1.34 | 1.04–7.03 | |
| PLR | |||
| Median (IQR) | 157.90 (145–179) | 181.50 (126.50–300) | .275 |
| Range | 134–185.5 | 64–730 | |
ESR: erythrocyte sedimentation rate, CRP: C reactive protein, Anti-ds DNA: anti-double stranded DNA, IQR: inter-quartile range, C3: complement 3, C4: complement 4, NLR: neutrophil to lymphocyte ratio, PLR: platelet to lymphocyte ratio.
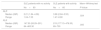
A significant increased value of both ratios of SLE patients who are with active SLE disease (Table 2).
Comparison Between SLE Patients With no Activity and SLE Patients Who Are in Activity as Regard NLR and PLR.
| SLE patients with no activity | SLE patients with activity | Mann–Whitney test | |
|---|---|---|---|
| No=60 | No=60 | P-Value | |
| NLR | |||
| Median (IQR) | 2.21 (1.84–4.08) | 3.88 (2.84–5.55) | .024 |
| Range | 1.04–7.03 | 1.47–6.80 | |
| PLR | |||
| Median (IQR) | 147.50 (93.29–201) | 215 (177.15–476.30) | .005 |
| Range | 64–463.30 | 69–730 | |
NLR: neutrophil to lymphocyte ratio, PLR: platelet to lymphocyte ratio.
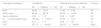
There was a statistically significant difference between LN patients and SLE patients with no renal affection as regard BUN, serum urea, serum creatinine, 24h urinary protein and NLR, but there was no statistically significant difference between them as regards PLR (Table 3).
Comparison of Laboratory Data Between Patients With and Without Lupus Nephritis.
| Laboratory parameters | LN patients | Patients with no renal affection | P-Value |
|---|---|---|---|
| No=60Mean±SD | No=60Mean±SD | ||
| BUN | 38.30±25.37 | 11.60±5.33 | .00 |
| Serum urea | 84.06±56.18 | 22.54±10.58 | .00 |
| Serum creatinine | 1.89±1.12 | 0.64±0.20 | .00 |
| 24h urinary protein (mg) | 1012.64±615.25 | 44.29±5.57 | .00 |
| NLR | 4.27±1.74 | 2.86±1.54 | .01 |
| PLR | 251.72±149.58 | 225.15±186.84 | 0.622 |
BUN: blood urea nitrogen, NLR: neutrophil to lymphocyte ratio, PLR: platelet to lymphocyte ratio.
NLR and PLR were positively correlated with SLEDAI score, ESR and CRP levels. Also, both ratios showed a significant negative correlation with C4 and a non-significant negative correlation with C3 (Table 4).
NLR and PLR Correlation With “SLEDAI, ESR, CRP, C3, C4, BUN, Urea, Creatinine, 24h Urinary Protein (mg).
| NLR ratio | PLR ratio | |||
|---|---|---|---|---|
| R | P-Value | R | P-Value | |
| SLEDAI | 0.525 | .001 | 0.512 | .001 |
| ESR | 0.383 | .015 | 0.464 | .003 |
| CRP | 0.363 | .021 | 0.353 | .025 |
| C3 | −0.200 | .215 | −0.301 | .059 |
| C4 | −0.377 | .016 | −0.475 | .002 |
| BUN | 0.423 | .007 | 0.147 | .366 |
| Urea | 0.441 | .004 | 0.142 | .382 |
| Creatinine | 0.460 | .003 | 0.303 | .057 |
| 24h urinary protein (mg) | 0.543 | .000 | 0.241 | .135 |
SLEDAI: Systemic Lupus Erythematosus Disease Activity Index, ESR: erythrocyte sedimentation rate, CRP: C reactive protein, C3: complement 3, C4: complement 4, BUN: blood urea nitrogen.
NLR showed positive correlations with BUN, serum urea, serum creatinine, and 24h urinary protein. Meanwhile, PLR showed no significant correlations with those parameters (Table 4).
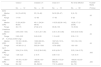
A statistically significant difference was found between SLE patients with no renal affection and LN patients with different renal biopsy classes as regards BUN, serum urea, serum creatinine, 24h urinary protein, and NLR. While no statistically significant difference was found between them as regards PLR with P-value .284 respectively (Table 5).
Comparison of NLR and PLR Values Depending on LN Histological Class.
| Class 2 | Classes 3, 4 | Class 5, 6 | No renal affection | Kruskal–Wallis | |
|---|---|---|---|---|---|
| No.=12 | No.=30 | No.=18 | No.=60 | P-Value | |
| BUN | |||||
| Median (IQR) | 24 (19–40.50) | 23 (16–46) | 54.50 (29–67) | 9 (8–15) | .00 |
| Range | 17–54 | 13–99 | 17–90 | 5–26 | |
| Urea | |||||
| Median (IQR) | 51.50 (40.50–86.50) | 49.11 (34.24–98.40) | 116.50 (62.06–143) | 19.26 (17.12–25.68) | .00 |
| Range | 36–115 | 27.82–212 | 36.38–193 | 10–55.64 | |
| Creatinine | |||||
| Median (IQR) | 0.95 (0.90–1.60) | 1.40 (1.20–1.80) | 3.40 (1.30–3.80) | 0.60 (0.50–0.80) | .00 |
| Range | 0.90–2.20 | 0.60–2.60 | 1.10–4.60 | 0.30–1.10 | |
| 24h urinary protein (mg) | |||||
| Median (IQR) | 151.35 (148.80–181.95) | 1069 (560.30–1201.20) | 1627.20 (1212–2016.80) | 100 (100–100) | .00 |
| Range | 147.60–211.2 | 505.30–1500 | 1078–2082 | 100–100 | |
| NLR | |||||
| Median (IQR) | 3.04 (2.14–3.20) | 3.93 (2.38–5.60) | 6.05 (4.59–7) | 2.25 (1.84–3.75) | .005 |
| Range | 1.38–3.23 | 2–5.75 | 3.86–7.03 | 1.04–6.70 | |
| PLR | |||||
| Median (IQR) | 161.50 (115.50–181.50) | 192.90 (130–386.40) | 266.50 (175.33–463.30) | 168.29 (102.35–233.82) | .284 |
| Range | 89–182 | 69–592.50 | 172.10–489.60 | 64–730 | |
BUN: blood urea nitrogen, NLR: neutrophil to lymphocyte ratio, PLR: platelet to lymphocyte ratio.
We found NLR to be related to both anti-ds-DNA and renal biopsy. While PLR to be related only to anti-ds-DNA and had no relation to renal biopsy (Table 6).
NLR and PLR Relation With Anti-double Stranded DNA and Renal Biopsy.
| NLR ratio | P-Value | PLR ratio | P-Value | ||
|---|---|---|---|---|---|
| Median (IQR) | Median (IQR) | ||||
| Anti-double stranded DNA | Negative | 2.21 (1.84–4.08) | 0.024 | 147.50 (93.29–201) | .005 |
| Positive | 3.88 (2.84–5.55) | 215 (177.15–476.30) | |||
| Renal biopsy | Normal | 2.25 (1.84–3.75) | 0.004 | 168.29 (102.35–233.82) | .256 |
| Class 2 | 3.04 (2.14–3.20) | 161.50 (115.50–181.50) | |||
| Class 3 | 2.38 (2.21–3.16) | 130 (123–187.80) | |||
| Class 4 | 5.60 (5.50–5.71) | 284 (198–463) | |||
| Class 5 | 6.05 (4.95–6.90) | 196.17 (173.72–340.15) | |||
| Class 6 | 5.45 (3.86–7.03) | 402.80 (316–489.60) |
Based on ROC curve analysis, for predicting SLE activity, the ideal NLR cutoff value of 2.2 had 90% sensitivity and 50% specificity. While the ideal PLR cutoff value of 132.9 had 95% sensitivity and 50% specificity (Fig. 1).
 analysis of NLR and PLR to predict SLE activity. The optimal NLR cutoff value of 2.2 had 90% sensitivity and 50% specificity {AUC=0.709, 95% confidence interval (CI), 0.542–0.875, P=.024}. While the optimal PLR cutoff value of 132.9 had 95% sensitivity and 50% specificity {AUC=0.762, 95% confidence interval (CI), 0.614–0.911, P=.005}.")
Receiver Operating Characteristic curve (ROC) analysis of NLR and PLR to predict SLE activity. The optimal NLR cutoff value of 2.2 had 90% sensitivity and 50% specificity {AUC=0.709, 95% confidence interval (CI), 0.542–0.875, P=.024}. While the optimal PLR cutoff value of 132.9 had 95% sensitivity and 50% specificity {AUC=0.762, 95% confidence interval (CI), 0.614–0.911, P=.005}.
For predicting lupus nephritis, the ROC/AUC analysis showed a sensitivity of 90%, and a specificity of 50% when a cutoff value of 2.2 was used for NLR. However, the AUCs for PLR is less than 0.7 (Fig. 2).
 analysis of NLR and PLR to predict lupus nephritis. The ROC/AUC analysis showed a sensitivity of 90%, and a specificity of 50% when a cutoff value of 2.2 was used for NLR {AUC=0.747, 95% CI, 0.594–.901, P=.007}. However, the AUCs for PLR is less than 0.7.")
Receiver Operating Characteristic curve (ROC) analysis of NLR and PLR to predict lupus nephritis. The ROC/AUC analysis showed a sensitivity of 90%, and a specificity of 50% when a cutoff value of 2.2 was used for NLR {AUC=0.747, 95% CI, 0.594–.901, P=.007}. However, the AUCs for PLR is less than 0.7.
The present study demonstrated that NLR and PLR levels were much increased in patients with SLE when compared to healthy controls. Besides, we found both ratios to be significantly increased in SLE patients with activity as compared to patients with no activity. It was also worthy of note that NLR and PLR were positively correlated with SLEDAI score and acute phase reactants (ESR and CRP levels). Also, both ratios showed a significant negative correlation with C4. Another important finding was that NLR was significantly increased in SLE patients with nephritis. Additionally, NLR showed positive correlations with BUN, serum urea, serum creatinine, and 24h urinary protein. Meanwhile, PLR showed no significant correlations with those parameters.
Moreover, we found a statistically significant difference between LN patients in different renal biopsy classes as regards NLR. NLR was found to be increased as histological stages of LN get more advanced. Furthermore, We found NLR to be related to anti-ds-DNA and the histological WHO classification of the renal biopsy, which is the current golden standard of LN and seems to be adequate for stating the degree of kidney injury in LN. However, no significant difference was found between LN patients in the different classes as regards PLR and also PLR showed only relation to anti-ds-DNA and not to the histological staging of renal biopsy.
An interesting notice in our results was that NLR and PLR could predict SLE activity and the development of LN. Based on the ROC curve, the best NLR cut-off value to predict activity in SLE patients was 2.2 with 90% sensitivity and 50% specificity, where the best PLR cut-off value was 132.9, with 95% sensitivity and 50% specificity. Also, we recorded the highest accuracy with NLR level of 2.2 for predicting LN, with a sensitivity of 90% and a specificity of 50%.
Our results suggest that we can use NLR and PLR as inflammatory markers indicating SLE activity, and that NLR is a predictor of renal involvement in SLE patients and it coincides with the histological renal biopsy classes.
It was found that relative changes in WBCs subsets occur under systemic inflammation, mainly in the form of lymphopenia and neutrophilia26 and WBC subtype counts had been identified as biomarkers of inflammation in several diseases. The inflammatory relationship between NLR and malignancy, ischemic injury, cardiovascular disease, and infection had been documented in many studies.27–29
PLR had been evaluated in patients with several diseases including chronic inflammatory diseases, malignancies, myeloproliferative disorders, cardiovascular diseases, and infectious diseases.30–36
SLE is a chronic autoimmune disease that follows relapsing-remitting courses. An early recognition of flares would reduce the long-term disease and drug-related co-morbidities.
Renal involvement is one of the main determinants of poor prognosis of SLE.37 Thus, early diagnosis and management of LN are highly desirable for SLE patients.38 So, the aim of the current study was the assessment of possible relation of two hematological ratios (NLR and PLR) to SLE activity and renal involvement and we found that NLR and PLR may serve as reliable and easily measurable biomarkers of SLE activity. We found NLR to be a potential non-invasive marker for predicting LN.
Our results are in accordance with Qin et al.14 who observed increased levels of NLR and PLR in SLE patients as compared to healthy controls. In that study, NLR was positively correlated with CRP, ESR, and SLEDAI score. PLR was positively correlated with SLEDAI score. In addition, NLR level of 2.06 was determined as a predictive cutoff value for the development of SLE, and NLR level of 2.66 as a predictor of LN. However, no cutoff value to predict LN could be determined for PLR as the AUCs were less than 0.7 which is consistent with our results.
For instance, the study of Wu et al.21 showed that NLR and PLR levels were much higher in SLE patients as compared to healthy control group. Both ratios were significantly associated with SLE Disease Activity index 2000 (SLEDAI-2K). Only NLR was significantly increased in SLE patients with nephritis. The best NLR cut-off value to predict SLE patients with severe disease was 2.26 with 75% sensitivity and 50% specificity, where the best PLR cut-off value for the severe disease was 203.85 with 42.3% sensitivity and 83.9% specificity.
Moreover, Ayna et al.22 found NLR to be significantly higher in LN group of patients as compared to SLE patients without renal affection. Besides, a positive correlation between NLR and CRP was found in LN group. They also reported that NLR cut-off value of 1.93 had 83% sensitivity and 54% specificity in differentiating SLE patients with or without nephritis.
The study of Oehandian et al.39 found that NLR cut-off value ≥1.93 had a sensitivity of 0.70 and a specificity of 0.67 in differentiating SLE patients from normal subjects.
Yolbas et al.40 found NLR and PLR to be higher in 51 SLE patients as compared to healthy control group. NLR was significantly higher in hypo complementemic than in normo complementemic SLE patients.
Hematological abnormalities are often seen in SLE. Anemia, leucopenia and thrombocytopenia may occur due to immune-mediated bone marrow depression or excessive peripheral cell destruction. Leucopenia in SLE may result from lymphopenia, neutropenia or the presence of both. Neutropenia is a common feature of SLE may be mediated by anti-neutrophil anti-bodies. Other possible causes for the hematological abnormalities in SLE are drugs and infection.41,42
The main advantages we can get from our results are that NLR and PLR can be easily calculated from routine blood counts and are less costly as compared to other inflammatory cytokines. In addition, these ratios are relatively stable as each WBCs count could be changed by dehydration/rehydration and diluted blood specimens.
However, there are some limitations to our study. Firstly, the retrospective design of the study. Thus, we need a prospective study to confirm the results. Secondly, the relatively small sample sized that could limit the generalization of our findings in LN patients. Finally, we did not study the influence of treatment on NLR and PLR.
In conclusion, we present evidence that we can use PLR and NLR as inflammatory markers to evaluate disease activity in SLE patients as there is a correlation between both NLR and PLR and SLEDAI. Also, NLR could reflect renal involvement in SLE patients as it is correlated to LN and is associated with the different classes of its histological staging.
SupportThe research was not funded. Costs were the responsibility of the authors and instruments used in the study belong to Faculty of Medicine, a part of Ain Shams University, which is a public governmental organization. The authors write down no relationships/conditions/circumstances that present a potential financial conflict of interest. No other financial disclosures.
Conflicts of InterestsThe authors declared no conflicts of interest with respect to the authorship and/or publication of this article.


