
To determine the use of resources and economic impact of patients with gout at the population level.
Patients and methodsObservational design analyzing records belonging to 6 primary care centers and 2 hospitals. We included patients’ ≥18 years with an acute episode of gout over the years 2003–2007. Patient follow-up was 2 years. It produced two study groups: patients with 1–2 attacks/acute recurrences and 3 or more events. Main variables were: demographic, co-morbidity, metabolic syndrome (MS), and resource use and health/non-health costs. Statistical analysis: logistic regression-model ANCOVA, P<.05.
Results3130 patients with gout were included. Prevalence: 3.3%, mean age: 55.8 years male: 81.1%. Groups were distributed as follows: 68.4% had 1–2 acute attacks and 31.6% with 3 or more, P<.001. The prevalence of MS was 28.8% (confidence interval [CI] 95% CI: 27.2%–30.4%). The average/unit cost was € 2228.6 (direct costs: 96.9%), 90.8% in primary care (visits: 23.5%; drugs: 57.7%). For groups, the average corrected model/unit total cost per patient was € 2130.6 vs € 2605.4, respectively (P<.001). In all cost components, the results were higher in the group with ≥3 attacks. The subgroup of diabetic patients (No.=641, 20.5%) had a higher cost (€ 3124.8 vs € 1997.8, P<.001).
ConclusionsGout is associated with substantial morbidity, presence of MS and resource consumption. The study provides useful data on the cost of the disease; the costs of outpatient follow up are the highest.
Determinar el uso de recursos y el impacto económico de los pacientes con gota en un ámbito poblacional.
Pacientes y métodosDiseño observacional (multicéntrico) realizado a partir de registros pertenecientes a 6 centros de atención primaria y 2 hospitales. Se incluyó a pacientes ≥ 18 años con un episodio agudo de gota durante los años 2003-2007. El seguimiento de los pacientes fue de 2 años. Se confeccionaron 2 grupos de estudio: pacientes con 1-2 ataques/recurrencias agudas y con 3 o más. Principales variables: sociodemográficas, comorbilidad, síndrome metabólico (SM), y uso de recursos y costes sanitarios/no sanitarios. Análisis estadístico: regresión-logística, modelo de ANCOVA; p<0.05.
ResultadosSe incluyó a 3.130 pacientes con gota. Prevalencia: 3,3%; edad media: 55,8 años; varones: 81,1%. Por grupos: el 68,4% presentó 1-2 ataques agudos y el 31,6%, 3 o más, p<0.001. La prevalencia del SM fue del 28,8% (intervalo de confianza [IC] del 95%, 27,2-30,4%). El promedio/unitario del coste fue de 2.228,6 € (costes directos: 96,9%), el 90,8% en AP (visitas: 23,5%; medicamentos: 57,7%). Por grupos, en el modelo corregido el promedio/unitario de los costes totales por paciente fue de 2.130,6 € frente a 2.605,4 €, respectivamente (p<0.001). En todos los componentes del coste los resultados fueron mayores en el grupo con ≥ 3 ataques. El subgrupo de pacientes diabéticos (N=641; 20,5%) presentó un mayor coste (3.124,8 € frente a 1.997,8 €; p<0.001).
ConclusionesLa gota se asocia a una elevada morbilidad, presencia de SM y consumo de recursos. El estudio proporciona datos útiles sobre el coste de la enfermedad; siendo los costes de seguimiento ambulatorio los más elevados.
Gout is one of the most common causes of arthritis in patients over 40, its prevalence ranges from 0.5% to 5% of the general population.1,2 It is a disease characterized by the presence of inflammatory episodes, usually monoarticular and recurrent, often intense and self-limited.3,4 Clinical manifestations of gout occur in three phases: (a) acute attacks, (b) intercrisis periods (tophi are a late symptom of the disease), and (c) chronic arthropathy (multiple and/or persistent attacks).5–8
Available studies show that in patients with obesity, hypertension and/or diabetes (high cardiovascular risk), serum urate levels can be considered as a marker of inflammation, ischemia and oxidative stress of the cardiovascular system.9,10 The association between gout and the metabolic syndrome (MS) is well documented. Studies show that serum urate levels increase as the number of MS components increase, even when set against confounding factors such as age, gender, creatinine clearance, diuretic use and alcohol consumption.11–13 Overall, the prevalence of MS according to the criteria of the National Cholesterol Education Program Adult Treatment Panel III (NCEP-ATP III)14 ranges from 19% to 71%.
The available evidence regarding the use of resources and costs is limited.15,16 In the US it is estimated that the annual direct costs for treating new cases of gout in men is approximately $ 27.4 million.17 In the few studies reviewed there is a great variability in the methodology used to calculate these resources; moreover, they have been performed in very different groups of patients (cohort of employees, the elderly, etc.),18–21 circumstances that affect the comparability and external validity of the results. Given this scenario, and given the lack of data available in our country regarding the follow up of patients with gout in routine clinical practice situations, the performance of this type of study may be relevant. The objective of the study was to determine the use of resources and the economic impact (health and non-health costs) of patients with gout in a Spanish population setting with a follow-up period of 2 years.
Patients and MethodsStudy PopulationWe performed a multicenter observational design study from the review of medical records, in both outpatients and hospitalized patients. The study population consisted of people from 6 reformed primary care (PC) centers, managed by Badalona Serveis Assistencials (BSA). Information was obtained from the resources of two reference hospitals: Hospital Municipal de Badalona and Germans Trias i Pujol Hospital (specialized). The population assigned to the centers was mostly urban, of middle-low socioeconomic status, predominantly industrial. BSA is an integrated healthcare organization that provides coverage to a reference population of around 120000 in Badalona (Barcelona, Spain) and has 6 PC centers, one acute care hospital (Hospital Municipal de Badalona) and a health center. Their funding model is public and service providers are private, it is concerted (contract program) with the Catalan Health Service (CatSalut).
Inclusion and Exclusion CriteriaWe included in the study all patients consulting for an episode of gout (new or recurrent) from 01/01/2003 to 31/12/2007, and who met the following characteristics: (a) age ≥18 years; (b) regularly followed the protocol/clinical practice guidelines established in the centers, and (c) met the program requirements of the acute and chronic center. We excluded subjects transferred to other centers, the dead and those displaced or outside the area. Follow up of patients lasted 24 months (2 years) for the calculation of costs (health and non-health related). Depending on the number of episodes/recurrences, two study groups were formed: patients with 1–2 episodes and patients with 3 or more episodes (acute attacks).
Measures Related to GoutThe diagnosis of gout was obtained from the PC International Classification (CIAP-2), code T92, item 7 of diseases and health problems,22 and the International Classification of Diseases, Ninth Revision, Clinical Modification (ICD-9-CM)23 (codes: 274.x). Clinical validation was performed in cases of gout by confirmation of clinical courses in the patient history. Validation consisted of obtaining a random sample of 20 files, where we checked whether the clinical diagnosis of gout was consistent with the ACR criteria.6 In all cases, diagnostic accuracy was certified.
We estimated the prevalence of the disease as the percentage of individuals in the population presenting an episode of gout during the study period (period prevalence). The cumulative incidence rate was defined as the proportion of healthy individuals who developed the disease (new cases); the cumulative incidence, provides an estimate of the probability or the risk that an individual free from a specific illness develops during a specific period of time. No results were standardized as the population pyramid distributed by age and gender of the patients studied was similar to that of the population of Catalonia (source: National Statistics Institute). In addition, we determined the date of onset of illness (years of progression of the disease), the presence of hyperuricemia (dichotomous) and the origin of the patients (PC, hospital and/or outpatient).
Sociodemographic and Morbidity DataThe main variables were: age (continuous and ranges) and gender, and personal history obtained from the CIAP-222: hypertension (K86, K87), diabetes mellitus (T89, T90), dyslipidemia (T93), obesity (T82), smoking (P17), alcoholism (P15, P16), renal failure, cerebrovascular accident (K90, K91, K93), chronic obstructive pulmonary disease (R95, chronic airflow obstruction), asthma (R96), dementia or memory disorders (P70, P20), neurological diseases: Parkinson's disease (N87), epilepsy (N88), multiple sclerosis (N86) and other neurological diseases (N99); depressive syndrome (P76) and malignancies (all types, A79, B72-75, D74-78, F75, H75, K72, L71, L97, N74-76, R84-86, T71-73, U75-79, W72-73, X75-81, Y77-79).
As a summary variables of overall comorbidity for each patient treated, we used: (a) the Charlson comorbidity index24 as an approximation to the severity of the patient, and (b) the rate of individual causes, obtained from the Adjusted Clinical Groups (ACG), a patient classification system for resource self consumption.25 The ACG provides application resource utilization bands (BUR), so that each patient, based on their overall disease morbidity, is grouped into one of five mutually exclusive categories (1: healthy or very low morbidity, 2: low morbidity, 3: moderate morbidity, 4: high morbidity, and 5: very high morbidity).
The definition of MS was established when the subject met 3 of the 5 NCEP-ATP III modified criteria14: (a) triglycerides of 150mg/dl or greater; (b), high-density lipoprotein cholesterol less than 40mg/dl in men or less than 50mg/dl in women; (c) systolic/diastolic blood pressure 130/85mmHg or higher or antihypertensive treatment, (d) baseline fasting glucose level of 110mg/dl or more, or treatment with hypoglycemic drugs or previously diagnosed diabetes mellitus, and/or (e) body mass index of 28.8kg/m2 or higher (this value was considered equivalent to obesity or abdominal adiposity: waist circumference >102cm in men and >88cm in women; rationale used by different authors).26
Resource Use and Cost ModelWe considered non health related or indirect costs as those relating to the job productivity losses (job loss and disability days). The system design cost is defined taking into account the characteristics of organizations and the degree of development of the information systems available. The product unit that served as the basis for calculating the outcome (during the study period) was the patient treated and cost expressed in average cost per patient (cost/unit). Different concepts and the economic valuation study are detailed in Table 1 (for 2007). The different rates were obtained from the analytical accounts of the centers except medication and days off work. The requirements were quantified according to the retail price per bottle at the time of prescription. The days of work disability or productivity losses were considered as non-health costs (indirect costs). Cost is measured as the minimum wage (source: National Statistics Institute).27 Costs will be determined after a 2 year follow-up of patients.
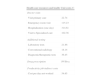
Detail of Costs/Unit and Lost Productivity.
| Health care resources and health | Unit costs, € |
| Doctor visits | |
| Visit primary care | 22.74 |
| Emergency room visit | 115.23 |
| Hospitalization (one day) | 314.61 |
| Visit to Specialized care | 102.36 |
| Additional testing | |
| Laboratory tests | 21.86 |
| Conventional radiology | 18.14 |
| Diagnostic/therapeutic tests | 36.45 |
| Drug prescription | PVPiva |
| Productivity job-indirect costs | |
| Cost per day not worked | 54.65 |
Source of health resources: own analytical accounting. Values expressed in euros. PVP: retail price.
We respected the confidentiality of records marked by the Organic Law on Data Protection (15/1999, of 13 December), with the data dissociation. The study was classified by the Spanish Agency for Medicines and Health Products (EPA-OD) and subsequently approved by the Ethics Committee for Clinical Research, University Hospital Germans Trias i Pujol in Badalona.
Statistical AnalysisStatistical analysis was performed with univariate descriptive values of mean, typical/standard deviation (SD) and confidence intervals (CI) of 95%, and with the Kolmogorov–Smirnov test to assess the normal distribution. In the bivariate analysis we not only used ANOVA and chi-square tests, but also Pearson linear correlation. We performed a logistic regression analysis to determine the variables associated with the presence of ≥3 outbreaks (dependent variable) with procedure enter (Statistical Wald). Comparison of outpatient and hospital cost was performed as recommended by Thompson and Barber28 by analysis of covariance (ANCOVA), with gender, age, BUR, and the Charlson index as covariates (procedure: estimate of marginal means, Bonferroni adjustment). We used SPSSWIN v. 18, establishing a statistical significance of P values <.05.
ResultsFrom an initial screening of 96206 subjects ≥18 years assigned to the centers, we enrolled 3130 patients with gout. The overall prevalence was 3.3% (95% CI: 2.7%–3.9%). The estimated cumulative incidence rate was 1.1 new cases/1000 inhabitants/year. Regarding study groups, 2142 (68.4%) had 1–2 acute attacks and 988 (31.6%) 3 or more recurrences, P<.001. The mean±SD age was 55.8±12.2 years and 81.1% were male. Of all patients, 43.6% were hypertensive, 43.1% obese and 40.5% dyslipidemic. The prevalence of MS was 28.8% (95% CI: 27.2%–30.4%).
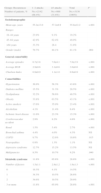
Table 2 describes the general characteristics of the series and comorbidities associated with gout in patients according to the 2 study groups. Subjects with ≥3 acute attacks/relapses showed a higher mean age (57.2 vs 55.2 years, P<.001), and a higher proportion of males (84.1% vs 79.7%, P=.004). These subjects had a higher proportion of comorbidities: BUR (3.1 vs 2.9, P<.001) and Charlson index (1.1 vs 0.9, P<.001). In the corrected logistic regression model, subjects with ≥3 acute attacks/relapses were associated with MS (odds ratio [OR]=6.2, 95% CI: 4.6–8.3), obesity (OR=2.1, 95% CI: 1.7–2.5) and hypertension (OR=1.6, 95% CI: 1.3–1.9), P<.001. MS had a moderate linear correlation with the number of acute attacks (r=0.517), years of disease progression (r=0.321) and initial levels of uric acid (r=0.278), P<.001. Baseline characteristics of gouty arthropathy are detailed in Table 3, 89.1% of subjects had hyperuricemia and 84.7% of the cases were from PC. Subjects with ≥3 acute attacks/relapses showed increased monitoring in the rheumatology clinics (3.6% vs 0.8%, P<.001). Notably, only 16.9% of patients had a definite diagnosis of gout (displaying monosodium urate crystals under a microscope). Regarding the study groups, in subjects with ≥3 acute attacks/recurrence was 29.0% vs 11.3%, P<.001.
Baseline Characteristics of the Studied Series.
| Groups: Recurrences | 1–2 attacks | ≥3 attacks | Total | P |
| Number of patients, % | No.=2142 (68.4%) | No.=988 (31.6%) | No.=3130 (100%) | |
| Sociodemographic | ||||
| Mean age, years | 55.2±13.0 | 57.2±9.9 | 55.8±12.2 | <.001 |
| Ranges | ||||
| 18–44 years | 23.9% | 9.1% | 19.2% | |
| 45–64 years | 42.9% | 62.4% | 49.0% | |
| >64 years | 33.3% | 28.4 | 31.8% | |
| Gender (male) | 79.7% | 84.1% | 81.1% | .004 |
| General comorbidity | ||||
| Average episodes | 6.7±3.8 | 7.6±4.1 | 7.0±3.9 | <.001 |
| Average BUR | 2.9±0.6 | 3.1±0.6 | 3.0±0.6 | <.001 |
| Charlson Index | 0.9±0.9 | 1.1±1.0 | 0.9±0.9 | <.001 |
| Comorbidities | ||||
| Hypertension | 36.9% | 58.3% | 43.6% | <.001 |
| Diabetes mellitus | 15.5% | 31.3% | 20.5% | <.001 |
| Dyslipidemia | 32.2% | 58.6% | 40.5% | <.001 |
| Obesity | 33.8% | 63.5% | 43.1% | <.001 |
| Active smokers | 17.6% | 35.9% | 23.4% | <.001 |
| Alcoholism | 4.1% | 11.4% | 6.4% | <.001 |
| Ischemic heart disease | 11.6% | 23.3% | 15.3% | <.001 |
| Cerebrovascular accident | 2.9% | 8.2% | 4.6% | <.001 |
| Renal | 1.5% | 5.4% | 2.7% | <.001 |
| Bronchial asthma | 4.4% | 4.0% | 4.3% | NS |
| COPD | 9.7% | 12.6% | 10.6% | .015 |
| Neuropathies | 0.9% | 1.3% | 1.1% | NS |
| depressive syndrome | 12.7% | 15.2% | 13.5% | NS |
| Malignancies | 8.5% | 10.7% | 9.2% | .040 |
| Metabolic syndrome | 11.8% | 65.8% | 28.8% | <.001 |
| Number of factors | 1.5±1.1 | 2.8±1.2 | 1.9±1.3 | <.001 |
| 0 | 19.3% | 4.1% | 14.5% | |
| 1 | 34.3% | 10.5% | 26.8% | |
| 2 | 34.6% | 19.5% | 29.9% | |
| 3 or more | 11.8% | 65.9% | 28.8% | <.001 |
BUR: resource utilization bands; COPD: chronic obstructive pulmonary disease; NS: not significant; P: statistical significance.
Values expressed as percentage or mean±standard deviation.
Baseline Characteristics of Gouty Arthropathy.
| Groups: Recurrences | 1–2 attacks | ≥3 attacks | Total | P |
| Number of patients, % | No.=2142 (68.4%) | No.=988 (31.6%) | No.=3130 (100%) | |
| Features | ||||
| Progression gout, years | 4.4±1.1 | 5.2±1.4 | 4.6±1.2 | <.001 |
| Average acute attacks | 1.4±0.5 | 4.4±1.5 | 2.3±1.7 | <.001 |
| Presence of hyperuricemia | 85.1% | 97.9% | 89.1% | <.001 |
| Origin of patients | ||||
| Primary | 88.1% | 77.1% | 84.7% | |
| Triage | 11.1% | 19.2% | 13.6% | |
| Hospital visits | 0.8% | 3.6% | 1.7% | <.001 |
NS: not significant; P: statistical significance.
Values expressed as percentage or mean±standard deviation.
Distribution of the number of attacks/acute: 1 (No.=1315, 42.0%), 2 (No.=827, 26.4%), 3 (No.=325, 10.4%), 4 (No.=292, 9.3%), 5 (No.=184, 5.9%), 6 (No.=100, 3.2%) 7 (No.=54; 1.7%), 8 (No.=15, 0.5%), ≥9 (No.=18, 0.6%).
Hyperuricemia is obtained from the first determination of uric acid acute attack.
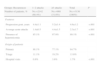
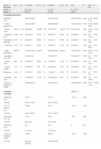
The gross prospective and adjusted cost model (up to 24 months) associated with gout according to the study groups is described in Table 4. The total cost of the patients included in the study amounted to 7 million euros, of which 96.9% were direct health costs and 3.1% non-healthcare costs (lost productivity), with an average/€ 2228.6 total unit. For groups, the total costs (health, non-health) of subjects with 1–2 attacks of gout were lower compared with those with ≥3 attacks (€ 2028.6 vs € 2662.2). The percentage distribution of the cost is 90.8% in PC and 6.2% in specialized care, of these, 23.5% of visits occurred in PC and 57.7% in drug prescription. In the corrected multivariate model, costs were lower in the group with 1–2 attacks, especially total healthcare costs (€ 2101.5 vs € 2517.4, P<.001) and in PC (1987.6 € vs € 2331.3, P<.001). The average/unit of the total costs per patient was € 2130.6 vs € 2605.4 respectively (P<.001). In all the cost components results were higher in the group with ≥3 attacks. During the study period, patients with ≥3 acute attacks/relapses showed a higher average number of job loss (2.3 vs 1.2, P<.006) and days off work (0.6 vs 2.6 days, P<.001).
Model of Gross and Corrected Costs.
| Groups of arthropathy | Use, % | PU | 1–2 attacks | Use, % | PU | ≥3 attacks | Use, % | PU | Total | Pa | Total cost | % |
| Number of patients, % | No.=2142 (68.4%) | No.=988 (31.6%) | No.=3130 (100%) | |||||||||
| Cost model uncorrected | ||||||||||||
| Healthcare costs | 1993.6±1538.7 | 2522.4±1773.8 | 2160.5±1634.9 | <.001 | 6762332.1 | 96.9% | ||||||
| Costs in primary care | 1881.3±1390.4 | 2328.6±1628.0 | 2022.5±1484.0 | <.001 | 6330381.0 | 90.8% | ||||||
| Doctor visits | 100.0% | 22.0 | 499±383.9 | 100.0% | 25.3 | 576.7±374.6 | 100.0% | 23.0 | 523.7±382.6 | <.001 | 1639281.1 | 23.5% |
| Laboratory tests | 95.2% | 6.0 | 130.3±92.6 | 97.9% | 7.3 | 160.5±91.2 | 96.1% | 6.4 | 139.8±93.2 | <.001 | 437571.6 | 6.3% |
| Conventional radiology | 81.7% | 2.1 | 38.6±38.7 | 88.8% | 2.5 | 46.1±41.5 | 83.9% | 2.3 | 41.0±39.8 | <.001 | 128267.9 | 1.8% |
| Other tests | 43.1% | 0.8 | 29.2±47.3 | 55.4% | 1.1 | 39.5±52.5 | 47.0% | 0.9 | 32.5±49.2 | <.001 | 101586.2 | 1.5% |
| Drug prescription | 100.0% | 1183.9±1166.4 | 100.0% | 1505.9±1421.8 | 100.0% | 1285.5±1261.3 | <.001 | 4023674.1 | 57.7% | |||
| Specialized care costs | 112.3±501.8 | 193.8±545.0 | 138.0±517.1 | <.001 | 431951.2 | 6.2% | ||||||
| Doctor visits | 8.8% | 0.5 | 53.9±186.2 | 20.6% | 1.0 | 97.4±249.7 | 13.2% | 0.7 | 67.6±209.2 | <.001 | 211578.1 | 3.0% |
| Days in hospital | 1.1% | 0 | 42.9±425.6 | 6.3% | 0.3 | 81.2±436.6 | 3.1% | 0.2 | 55.0±429.4 | .020 | 172091.7 | 2.5% |
| Emergency | 11.0% | 0 | 15.5±49.2 | 11.6% | 0 | 15.2±44.2 | 11.2% | 0.1 | 15.4±47.6 | NS | 48281.4 | 0.7% |
| Nonhealth costs | 5.5% | 0 | 35.1±550.0 | 17.3% | 2.6 | 139.8±1116.2 | 9.8% | 1.3 | 68.1±775.7 | <.001 | 213189.6 | 3.1% |
| Total costs (health/non-health) | 2028.6±1661.8 | 2662.2±2143.1 | 2228.6±1850.7 | <.001 | 6975521.8 | 100.0% | ||||||
| Corrected cost model | Difference | |||||||||||
| Healthcare costs | 2101.5 | 2517.4 | −415.9 | <.001 | ||||||||
| 95% CI | 2024.1–2179.1 | 2391.2–2643.5 | ||||||||||
| Costs in primary care | 1987.6 | 2331.3 | −343.7 | <.001 | ||||||||
| 95% CI | 1917.5–2057.6 | 2217.3–2445.3 | ||||||||||
| Specialized care costs | 113.9 | 186.2 | −72.3 | .006 | ||||||||
| 95% CI | 86.9–141.1 | 141.9–230.1 | ||||||||||
| Nonhealth costs | 29.1 | 88.1 | 9. | .046 | ||||||||
| 95% CI | 11.9–69.8 | 21.8–154.2 | ||||||||||
| Total costs (health/non-health) | 2130.6 | 2605.4 | −474.8 | <.001 | ||||||||
| 95% CI | 2041.18–2220.08 | 2459.9–2750.9 | ||||||||||
CI: confidence interval; NS: not significant; P: statistical significance between the cost of the 2 study groups.
Values expressed as percentage or mean±standard deviation.
ANCOVA model: each F-test contrasts the simple effect of the presence of the dose combination in each of the remaining effects shown. These contrasts are based on pair comparisons, linearly independent, among the estimated marginal means. Covariates: age, BUR and Charlson index. Fixed component: gender. Use: percentage of resource use among all patients. PU: average/unit of resource use. Nonhealth costs refer to the days of lost work productivity.
The subgroup of diabetic patients (No.=641, 20.5%, 95% CI: 19.1%–21.9%) compared to non-diabetic ones, had a higher average unit total cost (€ 3124.8 vs € 1997.8, P<.001); these patients were older (61.9 vs 54.2 years, P=.001), had a higher disease burden (3.1 vs 2.8 BUR, P<.001) and frequency of MS (63.2% vs 20.1%, P<.001).
DiscussionThe overall results of the study show a prevalence of 3.3% for gout, with a grater male predominance and with 1–2 acute attacks. These features are similar to most of the population-wide studies reviewed.3,4 Although it should be noted that the natural history of the disease may hinder its diagnosis, especially in primary care and in the emergency department, where the presence of a joint acute attack may mimic other disease entities making for a difficult differential diagnosis.3,6,8 According to the NCEP,14 the prevalence of MS was 28.8%, highlighting its association with obesity, hypertension and high baseline levels of uric acid. Our results are similar to data from other studies reviewed.7,8,11–13 It is worth considering that in our country the prevalence of MS and its association with gout may be higher. Some authors put the figures at around 50% in patients over 60% and 35% in patients with gout in the general population.29
In the study, the average/unit cost was € 2228.6. The average corrected model/unit total costs per patient was € 2130.6 (1–2 attacks) vs € 2605.4 (≥3 attacks). In all components result costs were higher in the group with ≥3 attacks and the subgroup of diabetic patients. In this aspect, Brook et al.,21 demonstrated that the total annual cost in a cohort of employees with gout was $ 6870, two times higher than patients without gout, noting that only 1% of employees with gout generated the 20% of the costs. Wu et al.,18 in an excellent study done in elderly patients, related the serum uric acid levels with the cost of patients with gout as being $ 2555. In the study by Mould-Quevedo et al.,19 on the main inflammatory rheumatic diseases from the patient's perspective in Mexico, the cost/year was $ 1006, mostly in outpatient costs. Our results are in line with those reported by Wu et al.,18 where the methodology was similar to that described in this paper, even when bearing in mind that their patients were older and probably with greater comorbidity. The other two studies mentioned previously (Wu et al.18 and Mould-Quevedo et al.19) are difficult to compare because they are made with older patients and also use different methodologies. All studies are coincident on the weight of the ambulatory costs. In our study, 96.9% were direct health costs and the increased costs were due to follow-up visits and medication. In this regard, increased monitoring of these patients in primary care could reduce costs related to the disease, although undoubtedly the associated morbidity, lack of compliance and possible predisposing factors may affect the use of resources and the cost of these30 patients.
It is important to note the scarce costs related to lost productivity (sick leave) generated by gout. One possible explanation is that we used a conservative information source (the minimum wage instead of average wage cost, which already in itself is a limitation of the study); it is also possible that temporary job loss was seen (early treatment or decompensation) and not registered by the insurers. The available evidence in this area regarding costs would be consistent with Ferraz20 and Joish,31 who show that patients with acute attacks of gouty arthritis lose an average of 3–5 days of work per year, causing significant economic losses to labor productivity that in some cases is a little less quantified. Although, in general, patients with 1–2 attacks are younger and therefore have a lower frequency than most of the associated disease, it may be this which determines the lowest cost of the disease in these patients.
Possible study limitations affect the categorization of the disease, the potential bias of patient classification (due to excess) and operating costs attributable to the information system developed. Therefore, in this paper we show the limitations of retrospective studies, such as underreported data or the possible variability of professionals and patients due to the observational design. Furthermore, the number of acute attacks treated may be compromised because of possible self-medication by patients. The study details the use of resources and the costs associated with gouty arthritis patients in a clinical practice situation. However, note that without adequate standardization of methodologies not only in terms of patient characteristics, but also the number and size of the variables studied, the results should be interpreted with caution forcing us to be cautious regarding the external results validity.
Future research studies call for the availability of cost/effectiveness and efficiency of diagnosis and treatment, in addition to replicating the study in other healthcare organizations. Moreover, the inflammatory property of crystals is not yet fully elucidated and may be linked to the ability to bind immunoglobulins, complement and lipids. It takes long-term clinical trials to test the hypothesis that uric acid lowering therapy can reduce cardiovascular risk in these patients. No guidelines have been established, derived from clinical trials, for the treatment of acute joint inflammation. The success of interventions for patients with chronic diseases such as gout should be based on multidisciplinary teams that promote effective care in which patients are highly engaged in their own care. Undoubtedly, the diagnosis and treatment of gout should require greater intervention strategy and be monitored by health professionals. In conclusion, gout is associated with substantial morbidity, MS and healthcare resource consumption. This study provides useful data on the cost of gout in Spain. The greatest costs are owed to the follow up of ambulatory patients.
Ethical disclosuresProtection of human and animal subjectsThe authors declare that no experiments were performed on humans or animals for this investigation.
Confidentiality of DataThe authors declare that they have followed the protocols of their work centre on the publication of patient data and that all the patients included in the study have received sufficient information and have given their informed consent in writing to participate in that study.
Right to privacy and informed consentThe authors have obtained the informed consent of the patients and /or subjects mentioned in the article. The author for correspondence is in possession of this document.
AuthorshipA. Sicras and R. Navarro conducted the literature search, extracted the data, performed the analysis and interpretation of the initial results. All authors contributed ideas, interpreted findings and reviewed drafts of the manuscript. All authors approved the final version of the article. A. Sicras is responsible for the study.
Conflict of InterestThe authors have no conflict of interest to make.
The authors acknowledge help from the different health professionals in the organization.
Please cite this article as: Sicras-Mainar A, et al. Uso de recursos e impacto económico de los pacientes con gota: estudio multicéntrico de ámbito poblacional. Reumatol Clin. 2013. http://dx.doi.org/10.1016/j.reuma.2012.06.014.