


Bibliometric studies of scientific production in Spanish Rheumatology are scarce. The aim of this study was to analyze the bibliographic production of Rheumatology Services in Spain over the period 2013-2022.
Materials and methodsOriginal articles and reviews with the affiliation of the first or corresponding author to a Spanish rheumatology Service/Department/Section/Unit were identified in the Web of Science Core Collection and Scopus databases. Keywords and titles were used to classify articles by field (clinical, epidemiological or basic) and pathology. International collaborations and collaborations between Autonomous Communities (AC) were identified. Quantitative bibliometric indicators were obtained (number of articles published per year, pathology and AC) and impact indicators were obtained (based on the number of citations per article). The H-index was also calculated.
ResultsThe total number of publications was 2321, with an annual growth rate of 4.1% in the period analyzed. In 14.1% of the articles there were international collaborations, mainly with the United States and the United Kingdom, while between ACs the most numerous were between Madrid and Catalonia. The pathologies with the highest H-index were rheumatoid arthritis (RA), spondyloarthropathies (SpA), osteoarthritis and vasculitis (34, 32, 28 and 26, respectively). The H-index for the Spanish rheumatology services as a whole was 69.
Discussion and conclusionsThe scientific production of rheumatology services/departments/sections/units in our country increased between 2013 and 2022. By pathology, the scientific production in RA and SpA stands out.
Los estudios bibliométricos sobre producción científica de la Reumatología española son escasos. El objetivo de este trabajo fue analizar la producción bibliográfica de los Servicios de Reumatología en España en la década 2013-2022.
Materiales y métodosSe identificaron artículos originales y revisiones con filiación del primer o autor de correspondencia en un Servicio/Departamento/Sección/Unidad de Reumatología de España en las bases Web of Science Core Collection y Scopus. Por palabras clave y título, se clasificaron los artículos por área (clínica, epidemiológica o básica) y patología. Se identificaron las colaboraciones internacionales y entre comunidades autónomas (CCAA). Se obtuvieron indicadores bibliométricos cuantitativos (número de artículos publicados por año, patología y CCAA) y de impacto (basados en el número de citas por artículo). Se calculó también el índice H.
ResultadosEl número total de publicaciones fue 2321, con una tasa de crecimiento anual en el periodo analizado del 4,1%. El 14,1% de los artículos se realizaron en colaboración internacional, principalmente con Estados Unidos y Reino Unido, mientras que entre CCAA las más numerosas fueron entre Madrid y Cataluña. Las patologías con mayor índice H fueron artritis reumatoide (AR), espondiloartropatías (EspA), artrosis y vasculitis (34, 32, 28 y 26, respectivamente). El índice H del conjunto de los Servicios de Reumatología españoles fue 69.
ConclusionesLa producción científica de los Servicios/Departamentos/Secciones/Unidades de Reumatología de España aumentó entre el 2013 y el 2022. Por patologías, destaca la producción científica en AR y EspA.
A major part of the prestige of healthcare institutions is determined by their research output and its quality. This is so much the case that in some hospitals scientific output is a strategic indicator that determines the selection criteria for medical staff, in relation to the added value of the research and teaching activity that these professionals can develop, together with the acquisition of economic resources that research projects provide to the institutions.1–4
Scientific publications are a key element for communicating advances in knowledge to the entire scientific community. Bibliometrics quantitatively studies scientific output in a specific area by identifying published works and statistically analysing bibliographic data, such as the number of publications or number of citations, providing objectivity in the evaluation of research activity.5 The number of bibliometric analyses in medicine has recently increased as a whole, and in Spain, covering multiple specialties.1,6–12
In rheumatology, bibliometric studies of Spanish scientific output do exist but are few in number and they focus on past decades.13–16 In the most recent, Maese Manzano carried out an analysis of the period 1997-2006, in which he observed a growing trend in scientific output and in the number of international collaborations.16
The growing pace of research activity in recent years and the increase of rheumatology as a specialty necessitated an updated, global and complete view of the scientific output of rheumatology services and departments in Spain, to detect the strengths and weaknesses of this specialty’s scientific system. As a result, the idea of carrying out a bibliometric analysis arose to provide a detailed understanding of the bibliographic output of rheumatology in Spain and thereby formulate strategies to encourage research and improve the positioning of the specialty.
The objective of this study was to identify and analyse the bibliographic production of rheumatology services in Spain from 2013 to 2022.
MethodsBibliographic search and publication selectionOriginal articles and reviews published between January 2013 and December 2022, corresponding to the category "Rheumatology" and affiliation in Spain, were identified from the databases of the Web of Science Core Collection (WoSCC), owned by ClarivateAnalytics, with access through the Spanish Foundation for Science and Technology (FECYT for its initials in Spanish) and Scopus (owned by Elsevier). Letters, leaders, positioning papers, abstracts, clinical cases and corrections were not included. The search strategies are included in Appendix B supplementary material. Depending on the database downloaded and the field and record delimiters used by each of them, macros were created in Microsoft Excel®, using, among other functions: extract, find, index and match, which allowed the automated construction of a structured database. After detecting and eliminating duplicates, only those articles in which the first or corresponding author or both had affiliation with rheumatology services/departments/sections/units of Spanish hospitals were selected for analysis.
Information analysesThe following information was available for each selected article: title, year of publication, journal, affiliation of the authors, keywords and number of citations (as of the date of download in WoSCC and Scopus: July 3 and 4, 2023).
Based on the analysis of the keywords and the title, each article was classified based on:
- -
Type of research: basic, epidemiological or clinical.
- -
The disease under study: rheumatoid arthritis (RA), spondyloarthropathy (SpA), juvenile idiopathic arthritis (JIA), systemic lupus erythematosus (SLE), Sjögren’s syndrome (SS), vasculitis, other systemic autoimmune diseases (scleroderma, inflammatory myopathies, mixed connective tissue disease, undifferentiated connective tissue disease, antiphospholipid syndrome, Behçet’s disease), uveitis, gout, osteoporosis, osteoarthritis, fibromyalgia, and infectious disease (arthritis or osteomyelitis). An “Other” group was included, which included publications on other diseases and publications not focused on a specific condition, such as articles on diagnostic procedures or treatment-related issues.
- -
The terms used for both classifications are listed in Appendix B supplementary material. The articles included in the “Others” group were manually reviewed to ensure that they did not include publications focused on any of the rheumatic diseases analysed individually.
Based on the affiliation of the first author, each article was assigned to an autonomous community.
Based on the affiliation of the 19 authors following the first author (this number was decided for practical reasons for the analysis) and that of the corresponding author, the following were identified:
- -
Collaborations between autonomous communities when the affiliation of some of the authors was different from that of the first author.
- -
International collaborations when some of the affiliations did not belong to a Spanish institution.
The following indicators were obtained from the analysed information:
- -
Production or quantitative: number of articles published per year, disease and autonomous community. For the comparison between autonomous communities, the number of articles was adjusted in 2 different ways:
- •
Dividing by the gross domestic product GDP) per capita of each autonomous community in 2022.17
- •
Dividing by the number of rheumatologists members of the Spanish Society of Rheumatology (SER) in 2020. This quotient was in turn divided by the number of rheumatologists/100,000 inhabitants, as a way of adjusting for the care load.18
- •
- -
Impact: median and 10th, 25th, 75th and 90th percentiles of citations per article, distribution of the number of articles according to the number of citations (0, 1 – 10, 10 – 19, ≥20), and value of the Hirsch H index, which combines productivity with impact (an n value of the H index indicates that there are n articles that have been cited at least n times each)19 These indicators were calculated by grouping the cited articles according to the disease under study and according to the autonomous community.
- -
Collaboration: number of collaborations between autonomous communities and international institutions.
The annual growth rate of the number of publications over time was calculated using the following fórmula20: [(number of documents in the last year/number of documents in the first year)1/(last year-first year) – 1] ×100.
Statistical analyses were performed using Stata® version 13.1 (Stata Corp., College Station, TX 2013), GraphPadPrism® 10 version 10.2.3 for Windows (GraphPad Software, Boston, Massachusetts, USA), and Microsoft Excel® 2021.
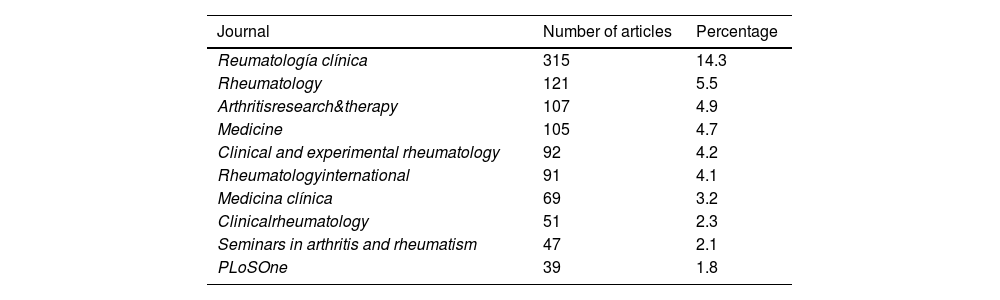
ResultsThe total number of articles published between 2013 and 2022 whose first author or corresponding author was affiliated with rheumatology services/departments/sections/units of Spanish centres was 2,321. Fig. 1 shows the results of the search and selection process for articles. Most were published in the journals REUMATOLOGÍA CLÍNICA (14.3%), Rheumatology (5.5%) and Arthritis Research &Therapy (4.9%) (Table 1). In 52.7%, the first author and the corresponding author were the same.

Journals with the highest number of publications during the 2013-2022 period.
| Journal | Number of articles | Percentage |
|---|---|---|
| Reumatología clínica | 315 | 14.3 |
| Rheumatology | 121 | 5.5 |
| Arthritisresearch&therapy | 107 | 4.9 |
| Medicine | 105 | 4.7 |
| Clinical and experimental rheumatology | 92 | 4.2 |
| Rheumatologyinternational | 91 | 4.1 |
| Medicina clínica | 69 | 3.2 |
| Clinicalrheumatology | 51 | 2.3 |
| Seminars in arthritis and rheumatism | 47 | 2.1 |
| PLoSOne | 39 | 1.8 |
Fig. 2 and Supplementary Appendix B Table 1 show the number of articles published by year and type of research. The annual growth rate of the total number of articles in the decade 2013-2022 was 4.1%; For basic, epidemiological and clinical research, it was 8.9%, 12.9% and 2.5%, respectively. Clinical research articles account for around 70%-80% of the total articles published each year. From 2020 onwards, and especially in 2021, there was an increase in all three types of research. In the case of clinical research, there was a decrease in 2022 compared to 2021, but not compared to 2020, when there was a slight increase.
.")
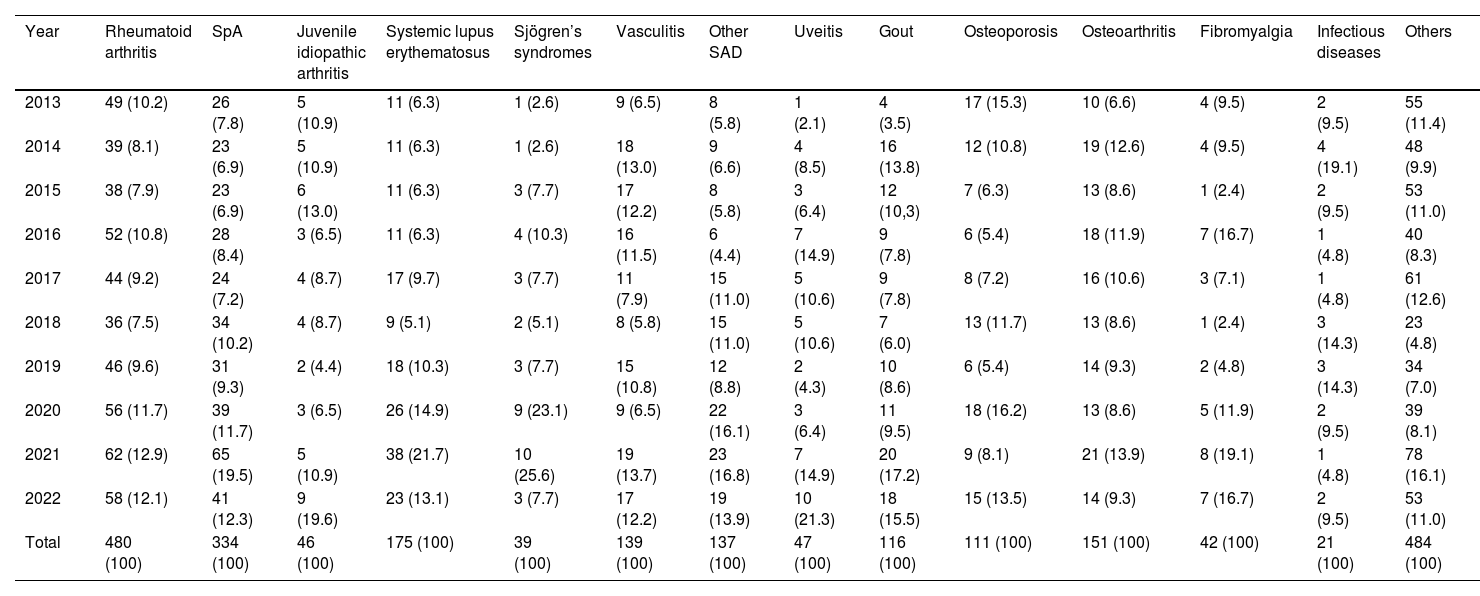
Table 2 shows the number of articles published per year, depending on the disease. For most of them, the highest numbers of published articles were in 2020, 2021 and 2022. In the decade as a whole, 20.7% of the documents specifically included RA in their title or keywords; 14.4%, SpA; This percentage was between 5% and 10% for SLE, osteoarthritis, gout, vasculitis and other SADs; for the rest of the diseases analysed, it was under 5%.
Number of articles by year and disease.
| Year | Rheumatoid arthritis | SpA | Juvenile idiopathic arthritis | Systemic lupus erythematosus | Sjögren’s syndromes | Vasculitis | Other SAD | Uveitis | Gout | Osteoporosis | Osteoarthritis | Fibromyalgia | Infectious diseases | Others |
|---|---|---|---|---|---|---|---|---|---|---|---|---|---|---|
| 2013 | 49 (10.2) | 26 (7.8) | 5 (10.9) | 11 (6.3) | 1 (2.6) | 9 (6.5) | 8 (5.8) | 1 (2.1) | 4 (3.5) | 17 (15.3) | 10 (6.6) | 4 (9.5) | 2 (9.5) | 55 (11.4) |
| 2014 | 39 (8.1) | 23 (6.9) | 5 (10.9) | 11 (6.3) | 1 (2.6) | 18 (13.0) | 9 (6.6) | 4 (8.5) | 16 (13.8) | 12 (10.8) | 19 (12.6) | 4 (9.5) | 4 (19.1) | 48 (9.9) |
| 2015 | 38 (7.9) | 23 (6.9) | 6 (13.0) | 11 (6.3) | 3 (7.7) | 17 (12.2) | 8 (5.8) | 3 (6.4) | 12 (10,3) | 7 (6.3) | 13 (8.6) | 1 (2.4) | 2 (9.5) | 53 (11.0) |
| 2016 | 52 (10.8) | 28 (8.4) | 3 (6.5) | 11 (6.3) | 4 (10.3) | 16 (11.5) | 6 (4.4) | 7 (14.9) | 9 (7.8) | 6 (5.4) | 18 (11.9) | 7 (16.7) | 1 (4.8) | 40 (8.3) |
| 2017 | 44 (9.2) | 24 (7.2) | 4 (8.7) | 17 (9.7) | 3 (7.7) | 11 (7.9) | 15 (11.0) | 5 (10.6) | 9 (7.8) | 8 (7.2) | 16 (10.6) | 3 (7.1) | 1 (4.8) | 61 (12.6) |
| 2018 | 36 (7.5) | 34 (10.2) | 4 (8.7) | 9 (5.1) | 2 (5.1) | 8 (5.8) | 15 (11.0) | 5 (10.6) | 7 (6.0) | 13 (11.7) | 13 (8.6) | 1 (2.4) | 3 (14.3) | 23 (4.8) |
| 2019 | 46 (9.6) | 31 (9.3) | 2 (4.4) | 18 (10.3) | 3 (7.7) | 15 (10.8) | 12 (8.8) | 2 (4.3) | 10 (8.6) | 6 (5.4) | 14 (9.3) | 2 (4.8) | 3 (14.3) | 34 (7.0) |
| 2020 | 56 (11.7) | 39 (11.7) | 3 (6.5) | 26 (14.9) | 9 (23.1) | 9 (6.5) | 22 (16.1) | 3 (6.4) | 11 (9.5) | 18 (16.2) | 13 (8.6) | 5 (11.9) | 2 (9.5) | 39 (8.1) |
| 2021 | 62 (12.9) | 65 (19.5) | 5 (10.9) | 38 (21.7) | 10 (25.6) | 19 (13.7) | 23 (16.8) | 7 (14.9) | 20 (17.2) | 9 (8.1) | 21 (13.9) | 8 (19.1) | 1 (4.8) | 78 (16.1) |
| 2022 | 58 (12.1) | 41 (12.3) | 9 (19.6) | 23 (13.1) | 3 (7.7) | 17 (12.2) | 19 (13.9) | 10 (21.3) | 18 (15.5) | 15 (13.5) | 14 (9.3) | 7 (16.7) | 2 (9.5) | 53 (11.0) |
| Total | 480 (100) | 334 (100) | 46 (100) | 175 (100) | 39 (100) | 139 (100) | 137 (100) | 47 (100) | 116 (100) | 111 (100) | 151 (100) | 42 (100) | 21 (100) | 484 (100) |
SAD: systemic autoimmune diseases; SpA: spondyloarthropathies.
The data represent the absolute number of publications for each disease per year and the annual percentage of publications in relation to the total number of publications for that disease.
Regarding the number of citations per disease, Table 3 shows the results for the period analysed. For all of them, except osteoarthritis, the largest number of articles were cited between one and 10 times, with a percentage of around 50% for most of them. Osteoarthritis was the disease with the highest proportion of articles with more than 20 citations (35.3%). The diseases with the highest H index were RA, SpA, osteoarthritis and vasculitis, with 34, 32, 28 and 26, respectively. For SLE, gout and osteoporosis the H index was higher than 20.
Distribution of the number of citations per article based on the disease and H index.
| Median | P10 | P25 | P75 | P90 | 0 citationsa | 1-10 citationsa | 11-20 citationsa | >20 citationsa | H index | |
|---|---|---|---|---|---|---|---|---|---|---|
| Rheumatoid arthritis | 7 | 0 | 2 | 17.5 | 36 | 55 (11.6) | 231 (48.5) | 92 (19.3) | 98 (20.6) | 34 |
| SpA | 7 | 0 | 2 | 16 | 31 | 42 (12.6) | 171 (51.4) | 62 (18.6) | 58 (17.4) | 32 |
| Juvenile idiopathic arthritis | 3 | 0 | 1 | 11 | 26 | 10 (23.8) | 20 (47.6) | 4 (9.5) | 8 (19.0) | 11 |
| Systemic lupus erythematosus | 6 | 0 | 1 | 15.5 | 28 | 32 (18.6) | 76 (44.2) | 31 (18.0) | 33 (19.2) | 24 |
| Sjögren’s syndrome | 6 | 1 | 4 | 16 | 27 | 3 (7.9) | 22 (57.9) | 6 (15.8) | 7 (18.4) | 13 |
| Vasculitis | 6 | 0 | 2 | 28 | 51 | 19 (13.9) | 64 (46.7) | 17 (12.4) | 37 (27.0) | 26 |
| Other SAD | 4 | 0 | 1 | 14 | 28 | 22 (16.4) | 68 (50.7) | 23 (17.2) | 21 (15.7) | 13 |
| Uveitis | 10 | 0 | 2 | 23 | 61 | 5 (10.9) | 19 (41.3) | 9 (19.6) | 13 (28.3) | 17 |
| Gout | 8 | 1 | 2 | 19 | 52 | 11 (9.6) | 55 (47.8) | 21 (18.3) | 28 (24.3) | 21 |
| Osteoporosis | 5 | 0 | 2 | 21.5 | 36 | 17 (15.7) | 49 (45.4) | 14 (13.0) | 28 (25.9) | 21 |
| Osteoarthritis | 12 | 1 | 4 | 29 | 52 | 11 (7.3) | 51 (34.0) | 35 (23.3) | 53 (35.3) | 28 |
| Fibromyalgia | 5 | 1 | 3 | 25 | 48 | 3 (7.7) | 23 (59.0) | 2 (5.1) | 11 (28.2) | 14 |
| Infectious diseases | 4 | 0 | 1 | 9 | 15 | 3 (14.3) | 14 (66.7) | 3 (14.3) | 1 (4.8) | 7 |
SAD: systemic autoimmune diseases; SpA: spondyloarthropathies.
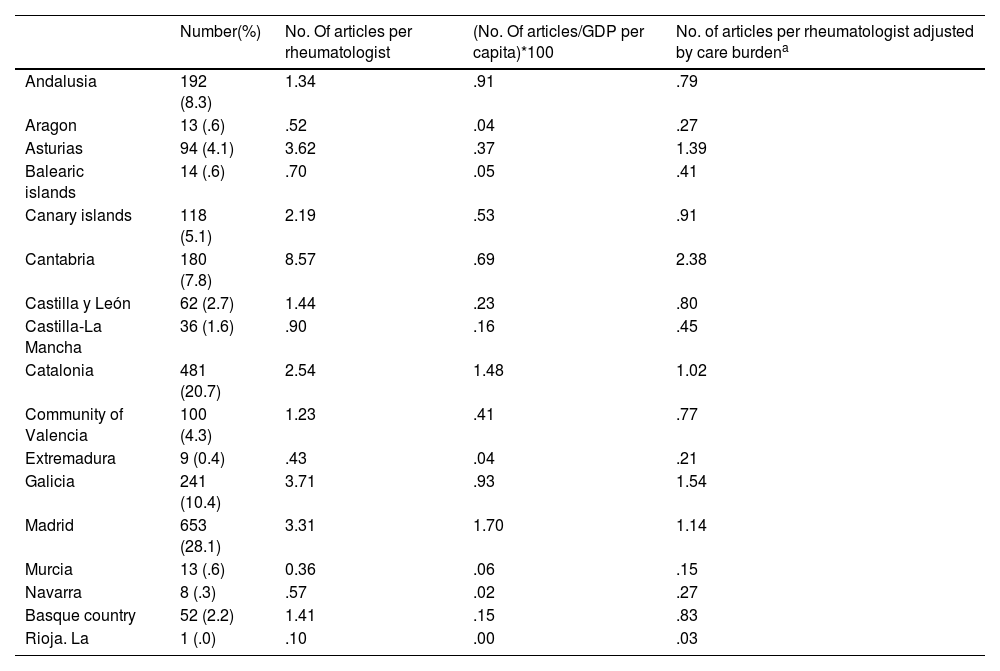
Table 4 shows the number of articles by autonomous community, taking into account GDP per capita and the number of rheumatologists per 100,000 inhabitants. With the first adjustment, the autonomous community with the highest scientific production in the period analysed was Madrid, followed by Catalonia, Galicia and Andalusia. If we take into account the number of rheumatologists per 100,000 inhabitants, the first was Cantabria, followed by Galicia, Asturias and Madrid. Appendix B Supplementary Table 2 and Appendix B Supplementary Fig. 1 show the analysis of the number of articles by the same first author in each autonomous community. For the whole of Spain, the median of this number was 1 [P25=1; P75=3] and a maximum value of 29. The number of first authors in the decade analysed was 965.
Number of articles by autonomous community. Raw data and data adjusted for wealth. capacity and care burden.
| Number(%) | No. Of articles per rheumatologist | (No. Of articles/GDP per capita)*100 | No. of articles per rheumatologist adjusted by care burdena | |
|---|---|---|---|---|
| Andalusia | 192 (8.3) | 1.34 | .91 | .79 |
| Aragon | 13 (.6) | .52 | .04 | .27 |
| Asturias | 94 (4.1) | 3.62 | .37 | 1.39 |
| Balearic islands | 14 (.6) | .70 | .05 | .41 |
| Canary islands | 118 (5.1) | 2.19 | .53 | .91 |
| Cantabria | 180 (7.8) | 8.57 | .69 | 2.38 |
| Castilla y León | 62 (2.7) | 1.44 | .23 | .80 |
| Castilla-La Mancha | 36 (1.6) | .90 | .16 | .45 |
| Catalonia | 481 (20.7) | 2.54 | 1.48 | 1.02 |
| Community of Valencia | 100 (4.3) | 1.23 | .41 | .77 |
| Extremadura | 9 (0.4) | .43 | .04 | .21 |
| Galicia | 241 (10.4) | 3.71 | .93 | 1.54 |
| Madrid | 653 (28.1) | 3.31 | 1.70 | 1.14 |
| Murcia | 13 (.6) | 0.36 | .06 | .15 |
| Navarra | 8 (.3) | .57 | .02 | .27 |
| Basque country | 52 (2.2) | 1.41 | .15 | .83 |
| Rioja. La | 1 (.0) | .10 | .00 | .03 |
Data obtained by dividing the number of articles per rheumatologist by the number of rheumatologists/100,000 inhabitants.
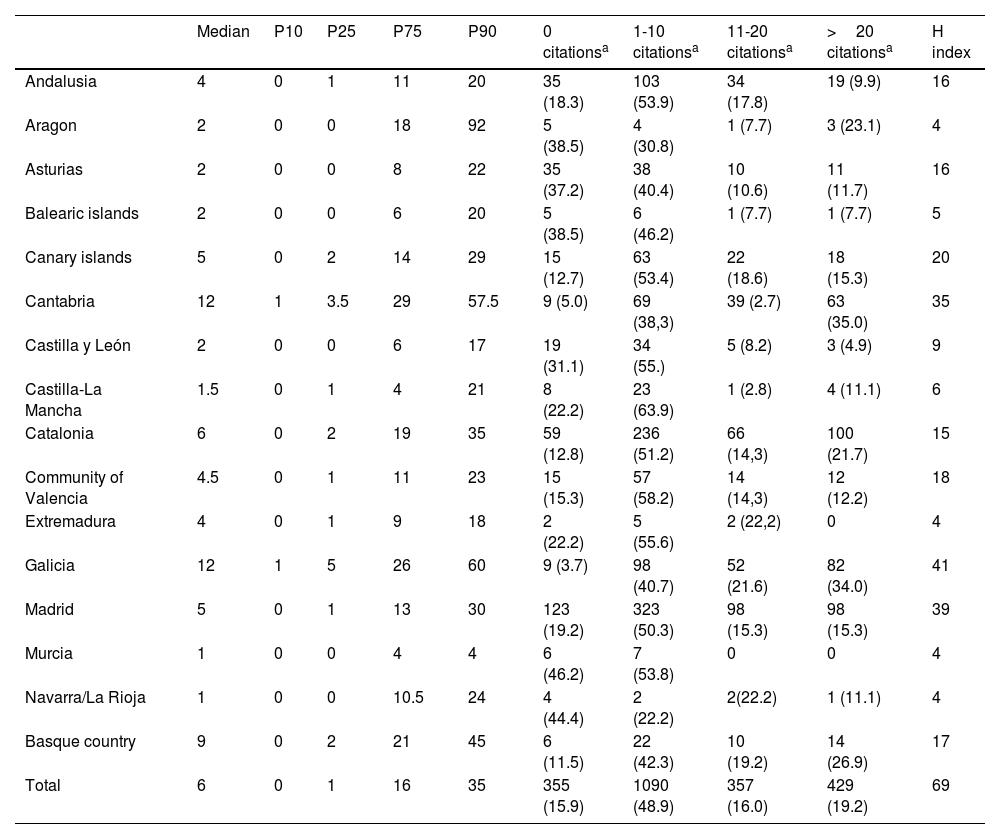
Table 5 shows the results relating to the number of citations by autonomous community. Cantabria, Galicia and the Basque Country had the highest median value (12, 12 and 9, respectively). In these 3 communities, a higher proportion of articles with more than 20 citations was also observed (35.0% 34.0% and 26.9%, respectively). Regarding the H index, the highest was that of Galicia (41), followed by Madrid (39) and Cantabria (35). For the whole of Spain, the proportion of articles with more than 20 citations was 19.2% and the H index was 69.
Distribution of the number of citations by article, autonomous community and H index.
| Median | P10 | P25 | P75 | P90 | 0 citationsa | 1-10 citationsa | 11-20 citationsa | >20 citationsa | H index | |
|---|---|---|---|---|---|---|---|---|---|---|
| Andalusia | 4 | 0 | 1 | 11 | 20 | 35 (18.3) | 103 (53.9) | 34 (17.8) | 19 (9.9) | 16 |
| Aragon | 2 | 0 | 0 | 18 | 92 | 5 (38.5) | 4 (30.8) | 1 (7.7) | 3 (23.1) | 4 |
| Asturias | 2 | 0 | 0 | 8 | 22 | 35 (37.2) | 38 (40.4) | 10 (10.6) | 11 (11.7) | 16 |
| Balearic islands | 2 | 0 | 0 | 6 | 20 | 5 (38.5) | 6 (46.2) | 1 (7.7) | 1 (7.7) | 5 |
| Canary islands | 5 | 0 | 2 | 14 | 29 | 15 (12.7) | 63 (53.4) | 22 (18.6) | 18 (15.3) | 20 |
| Cantabria | 12 | 1 | 3.5 | 29 | 57.5 | 9 (5.0) | 69 (38,3) | 39 (2.7) | 63 (35.0) | 35 |
| Castilla y León | 2 | 0 | 0 | 6 | 17 | 19 (31.1) | 34 (55.) | 5 (8.2) | 3 (4.9) | 9 |
| Castilla-La Mancha | 1.5 | 0 | 1 | 4 | 21 | 8 (22.2) | 23 (63.9) | 1 (2.8) | 4 (11.1) | 6 |
| Catalonia | 6 | 0 | 2 | 19 | 35 | 59 (12.8) | 236 (51.2) | 66 (14,3) | 100 (21.7) | 15 |
| Community of Valencia | 4.5 | 0 | 1 | 11 | 23 | 15 (15.3) | 57 (58.2) | 14 (14,3) | 12 (12.2) | 18 |
| Extremadura | 4 | 0 | 1 | 9 | 18 | 2 (22.2) | 5 (55.6) | 2 (22,2) | 0 | 4 |
| Galicia | 12 | 1 | 5 | 26 | 60 | 9 (3.7) | 98 (40.7) | 52 (21.6) | 82 (34.0) | 41 |
| Madrid | 5 | 0 | 1 | 13 | 30 | 123 (19.2) | 323 (50.3) | 98 (15.3) | 98 (15.3) | 39 |
| Murcia | 1 | 0 | 0 | 4 | 4 | 6 (46.2) | 7 (53.8) | 0 | 0 | 4 |
| Navarra/La Rioja | 1 | 0 | 0 | 10.5 | 24 | 4 (44.4) | 2 (22.2) | 2(22.2) | 1 (11.1) | 4 |
| Basque country | 9 | 0 | 2 | 21 | 45 | 6 (11.5) | 22 (42.3) | 10 (19.2) | 14 (26.9) | 17 |
| Total | 6 | 0 | 1 | 16 | 35 | 355 (15.9) | 1090 (48.9) | 357 (16.0) | 429 (19.2) | 69 |
Navarra and La Rioja are presented grouped for visualization purposes, taking into account their geographic proximity and that they are the 2 autonomous communities with the lowest number of articles.
Considering the autonomous community of the first author to assign the place of origin of the publication (Fig. 3), collaborations with other autonomous communities were detected in 862 articles (38.0%); the corresponding author was from a different community in 333 (14.7%). For all the autonomous communities, the highest number of collaborations was with Madrid, except in the case of Murcia, Navarra (with only 2 and 4 collaborations detected, respectively) and the Canary Islands (with which Madrid occupied second place, after Cantabria). The Balearic Islands, Cantabria and the Canary Islands were the Autonomous Communities of origin with the highest percentage of publications in which there was collaboration with others (78.6%, 70.0% and 58.5% of their articles, respectively). The highest number of collaborations occurred between Catalonia and Madrid, with a total of 204.
. It should be noted that in the same article there may be collaboration with more than one community. The “% of articles” column shows the percentage of articles with collaborations with other autonomous communities in the community of the corresponding row. In parentheses, the percentage of articles in which the corresponding author was from a different community. Both percentages are calculated on the total number of articles in the community of the corresponding row. Navarra and La Rioja are presented grouped for visualisation purposes, taking into account their geographic proximity and the fact that they are the 2 autonomous communities with the lowest number of articles.")
Number of collaborations between autonomous communities. The rows show the autonomous communities according to the affiliation of the first author. The columns show the autonomous communities according to the affiliation of the first 19 authors after the first author and the corresponding author. The “Total” column represents the total number of collaborations with other autonomous communities in the community of the corresponding row (i.e., the autonomous community of the first author). It should be noted that in the same article there may be collaboration with more than one community. The “% of articles” column shows the percentage of articles with collaborations with other autonomous communities in the community of the corresponding row. In parentheses, the percentage of articles in which the corresponding author was from a different community. Both percentages are calculated on the total number of articles in the community of the corresponding row. Navarra and La Rioja are presented grouped for visualisation purposes, taking into account their geographic proximity and the fact that they are the 2 autonomous communities with the lowest number of articles.
The number of publications with a first author with Spanish affiliation for which international collaboration was detected was 327 (14.1%). Following this criterion, Fig. 4 shows on the world map the countries with which there has been collaboration in some of the publications of the decade analysed. In Europe, the highest number of collaborations were with the United Kingdom (50), Italy (33), Holland (29) and France (20). In America, with the USA (61), Mexico (17) and Argentina (11). Out of the total number of articles, in only 28 (1.2%), the first author did not have Spanish affiliation, but the corresponding author did.
Discussion
In this study the scientific output of rheumatology services in Spain in the decade 2013-2022 was analysed through a bibliometric study, disaggregating the information based on the different diseases and autonomous communities, of affiliation of the first author. The greatest scientific output focused on RA and SpA. These 2 diseases showed the best output/impact relationship, with higher H indices. By autonomous community, the results would vary depending on the adjustment parameter used: GDP per capita or number of rheumatologists per 100,000 inhabitants. Madrid, Galicia, Cantabria, Catalonia, Asturias, Andalusia and the Canary Islands were the communities with the highest number of articles corrected by both parameters.
The impact of scientific output was analysed using the number of citations. The autonomous communities (A.C.) with the highest impact of their publications were Galicia, Cantabria and the Basque Country. These same communities, together with Madrid, the Canary Islands and the Community of Valencia showed the highest H indices in their scientific output. Osteoarthritis was the disease with the greatest impact, with only 7.3% of articles with 0 citations and 35.3% with more than 20.
Part of the increase observed from 2020 onwards could be due to publications related to COVID-19. In this sense, the number of articles with the terms covid or coronavirus in their title or keywords was 15, 30 and 29 in the years 2020, 2021 and 2022, respectively, which represented 5.9%, 8.2% and 10.0% of the articles published in those years.
Compared to the study by Maese Manzano, which analyses the scientific production of rheumatology in Spain in the decade 1997-2006, an increase is observed in the number of original articles and reviews. Regarding the distribution of scientific production by A.C., after adjusting for various economic parameters and the number of rheumatologists, the order is similar to that of rankings. The number of documents for which international collaboration was detected is greater in absolute numbers (327 in our study; 181 in Maese Manzano's), but lower in relative numbers (14.1% and 17.1%, respectively).16
Comparison with the rheumatological scientific output of other countries or with the production of other medical specialties in Spain is not among this study’s objectives and would be very limited by no coinciding of the periods analysed and/or by methodological differences, mainly in the databases used. In the case of rheumatological scientific output in other countries, there are also previous studies that have already made this comparison without the limitations mentioned, which place Spain around 15 to 20 after adjusting the number of publications for population or GDP parameters.1,6–12,21–28
Finally, international collaborations analysis has revealed their wide distribution, since there have been collaborations with countries from all continents. However, many of these collaborations have been one-off and only in the case of the USA, the United Kingdom, Holland, Italy and France have they equalled or exceeded 20 collaborations in the 10 years analysed.
One of the main strengths of this study is that a systematic search for publications was carried out in the two main databases (Scopus and WoS). The usual practice in this type of bibliometric analysis in the field of rheumatology is to use only one of them, a fact that, as previously mentioned, has limited the comparison of our results with those of other countries.21–28 However, the convenience of including both databases for greater search sensitivity is demonstrated by the fact that the number of duplicates represented a minority of the total number of articles retrieved, specifically 22.9%. Furthermore, the use of Pubmed was ruled out, as it lacked information on affiliation when downloading data.
One of the main limitations we found was the difficulty in standardising the information analysed. In this regard, we would highlight the lack of uniformity when signing and collecting affiliation, having identified numerous cases in which the same author recorded their name in different ways in the different articles. Beyond the objectives of this work, this represents an added difficulty when assigning publications to a specific author and institution and would have implications when defining the research curriculum. It is also possible that, in the case of authors with multiple affiliations, errors have occurred in the process of incorporating this information in the databases consulted, giving rise to the possibility that certain articles have not been selected in the present study. This would be the case of authors with hospital and university affiliations, if the affiliation recorded in the databases were limited to university. However, the impact on the study would be limited a priori.
Another limitation is the structure of the databases analysed, which do not permit identification of the last author. Although this practice is not defined in any standardised way by organisations such as the ICMJE, the interest of its analysis would be given because this position is usually reserved for the senior autor,29 It was for this reason that it was decided to analyse the first author and the corresponding author, who is classified as such in the databases and who often coincides with the first or last author. In our analysis, in 52.7% of the publications the first author and the corresponding author coincided. It was expected that a significant part of the remaining percentage corresponded to the last author.
A final limitation lies in the correction of scientific output by number of rheumatologists. The data on rheumatologists in the different autonomous communities were obtained from the SER membership database. |This database was updated to 2020 and although it mainly includes Spanish rheumatologists, the real data are underestimated. However, there is no reason to assume that this underestimation differs between autonomous communities, so the comparison data between them can be assumed to be real.
To conclude, we observed an increase in the scientific output of rheumatology in Spain, especially since 2020. In quantitative terms, scientific output in RA and SpA stood out, and in terms of impact, osteoarthritis. By autonomous communities, Madrid and Galicia would occupy the top positions in terms of number of publications. Regarding by number of citations, these two communities, and also Cantabria and the Basque Country rank the highest. This type of bibliometric analysis allows us to objectively understand the scientific output of rheumatology services in Spain, their areas of interest and their impact on the scientific community.
FundingThis analysis was funded by Alfasigma, which had no involvement in the study design, data analysis and interpretation, redaction or in the decision to submit the article for publication.
The following is Supplementary data to this article:


